

TL;DR: Five key insights
Meta is still the default channel. 91% of advertisers run paid social on Meta alone.
TikTok buys attention and clicks more cheaply. Its CPM is 3–4x lower across all campaigns, and a click costs about half as much.
Meta wins on engagement. It earns ~30% more interactions per $1 than TikTok.
For leads, TikTok looks about 2x cheaper, but test it. Cost per lead was $2.69 vs $6.00 (nobody measured lead quality though).
For sales, Meta is the proven option, but returns are shrinking. ROAS fell from 5.48 to 4.57 in a year, and the biggest spenders get the lowest return.
Deeper analysis below ↓
Marketers keep naming Instagram and TikTok among their best channels for ROI. Few studies go further and look at how campaigns actually perform, objective by objective, on a large sample. We found one that does.
At Stacy’s Brain we read marketing research so you don’t have to.
We don’t only pull out the numbers: we grade every source for methodology, sample and vendor interest, and tell you how far to trust each figure. That grading is what lets you make evidence-based decisions and grow efficiently.
The sources, and how much we can trust them
Social Ads Report 2026, Metricool.
Observed campaign results on Meta and TikTok from 44,355 advertisers, H1 2025 vs H1 2026.
Vendor interest: high (Metricool sells a cross-platform ads tool).
How we use it: as the backbone of the funnel comparison, trusting the ratios between platforms more than the absolute numbers.Instagram Study, Metricool.
Observed organic post performance across Metricool user accounts.
Vendor interest: high.
How we use it: to choose organic formats.2026 State of Marketing, HubSpot.
A survey of what marketers say works.
Vendor interest: moderate (HubSpot sells marketing software).
How we use it: to show what the market believes.CMO Spend Survey, Gartner.
A survey of CMO budgets.
Vendor interest: moderate (Gartner sells advisory).
How we use it: for budget context.TikTok Ads Benchmarks, Triple Whale.
Median ad costs across 5,900+ brands, Aug 2025–Jul 2026.
Vendor interest: high (Triple Whale sells ecommerce analytics).
How we use it: as a sanity check on Metricool’s costs.
In short, none of these sources is independent. Two of them measure what advertisers actually got (Metricool, Triple Whale), and two measure what marketers believe or budget (HubSpot, Gartner).
We treat those two kinds of evidence differently — and we’re here to compare them.
What marketers believe
HubSpot’s 2026 survey says Instagram overtook Facebook as the social platform with the highest ROI, and that TikTok’s perceived ROI rose sharply too. Overall, the perceived ROI of short-form video nearly doubled in a single year.
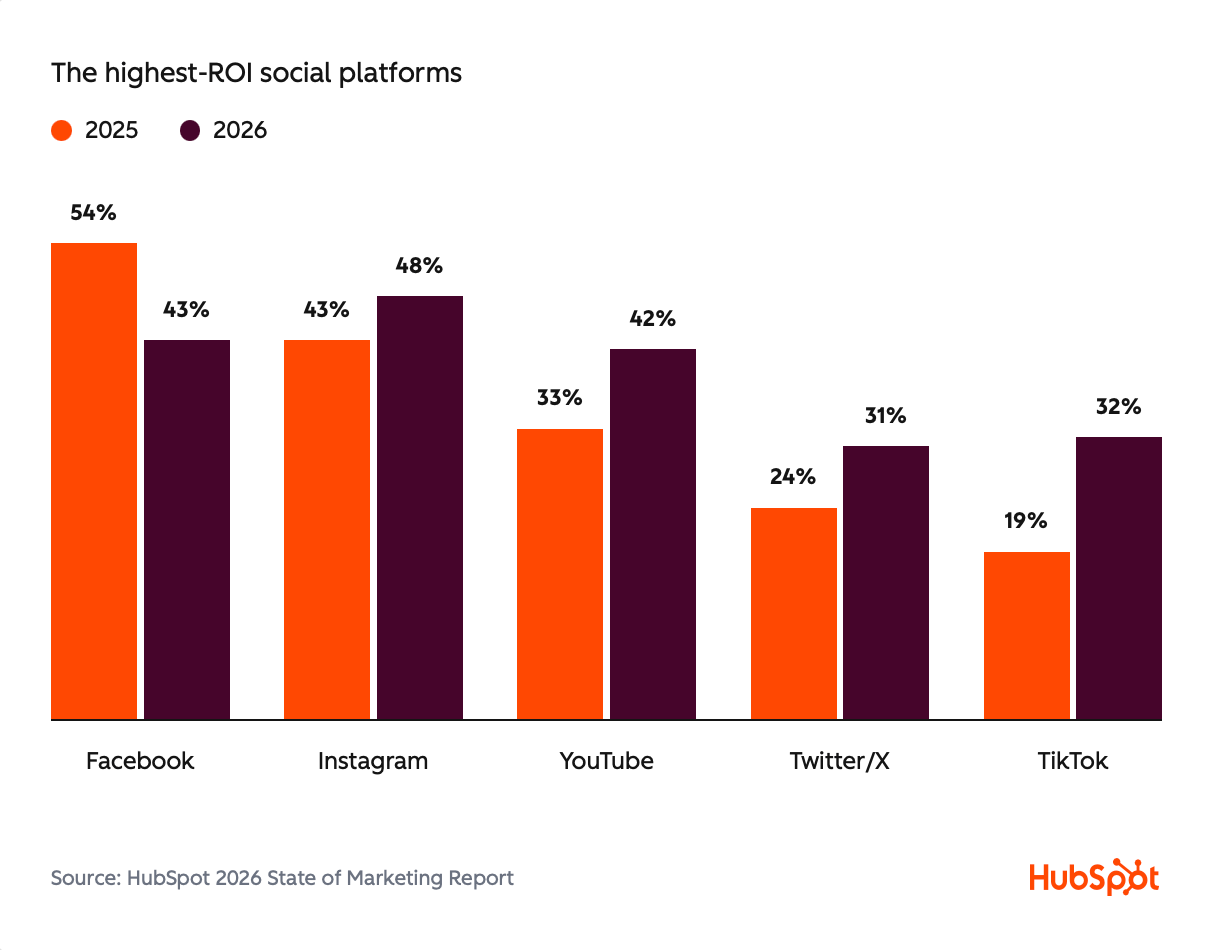
Note the word perceived.
These are marketers rating their own channels, not measured returns. Beliefs drive budgets, and budgets are tight: Gartner puts average marketing budgets at 7.7% of company revenue in 2025, down from 7.9%.
When money is a limited resource, betting it on a belief is expensive. So let’s see what the campaign data says.
Reality check #1: almost everyone is still on Meta
91% of advertisers in the Metricool dataset ran paid social only on Meta. About 4% used both platforms and 5% used only TikTok.
TikTok is growing inside that small group: among advertisers using both platforms, TikTok’s share of combined spend rose from 23.6% to 25.7% in a year. The smallest advertisers (under $100 a month) are the boldest, giving TikTok 44% of their budget.
Trust: medium.
These are observed numbers, but only from Metricool’s customers, not a random sample of advertisers.
Reality check #2: the numbers that look too good to be true
According to Metricool, Meta awareness campaigns cost $0.48 per 1K impressions (CPM) and Meta traffic campaigns cost $0.07 per click.
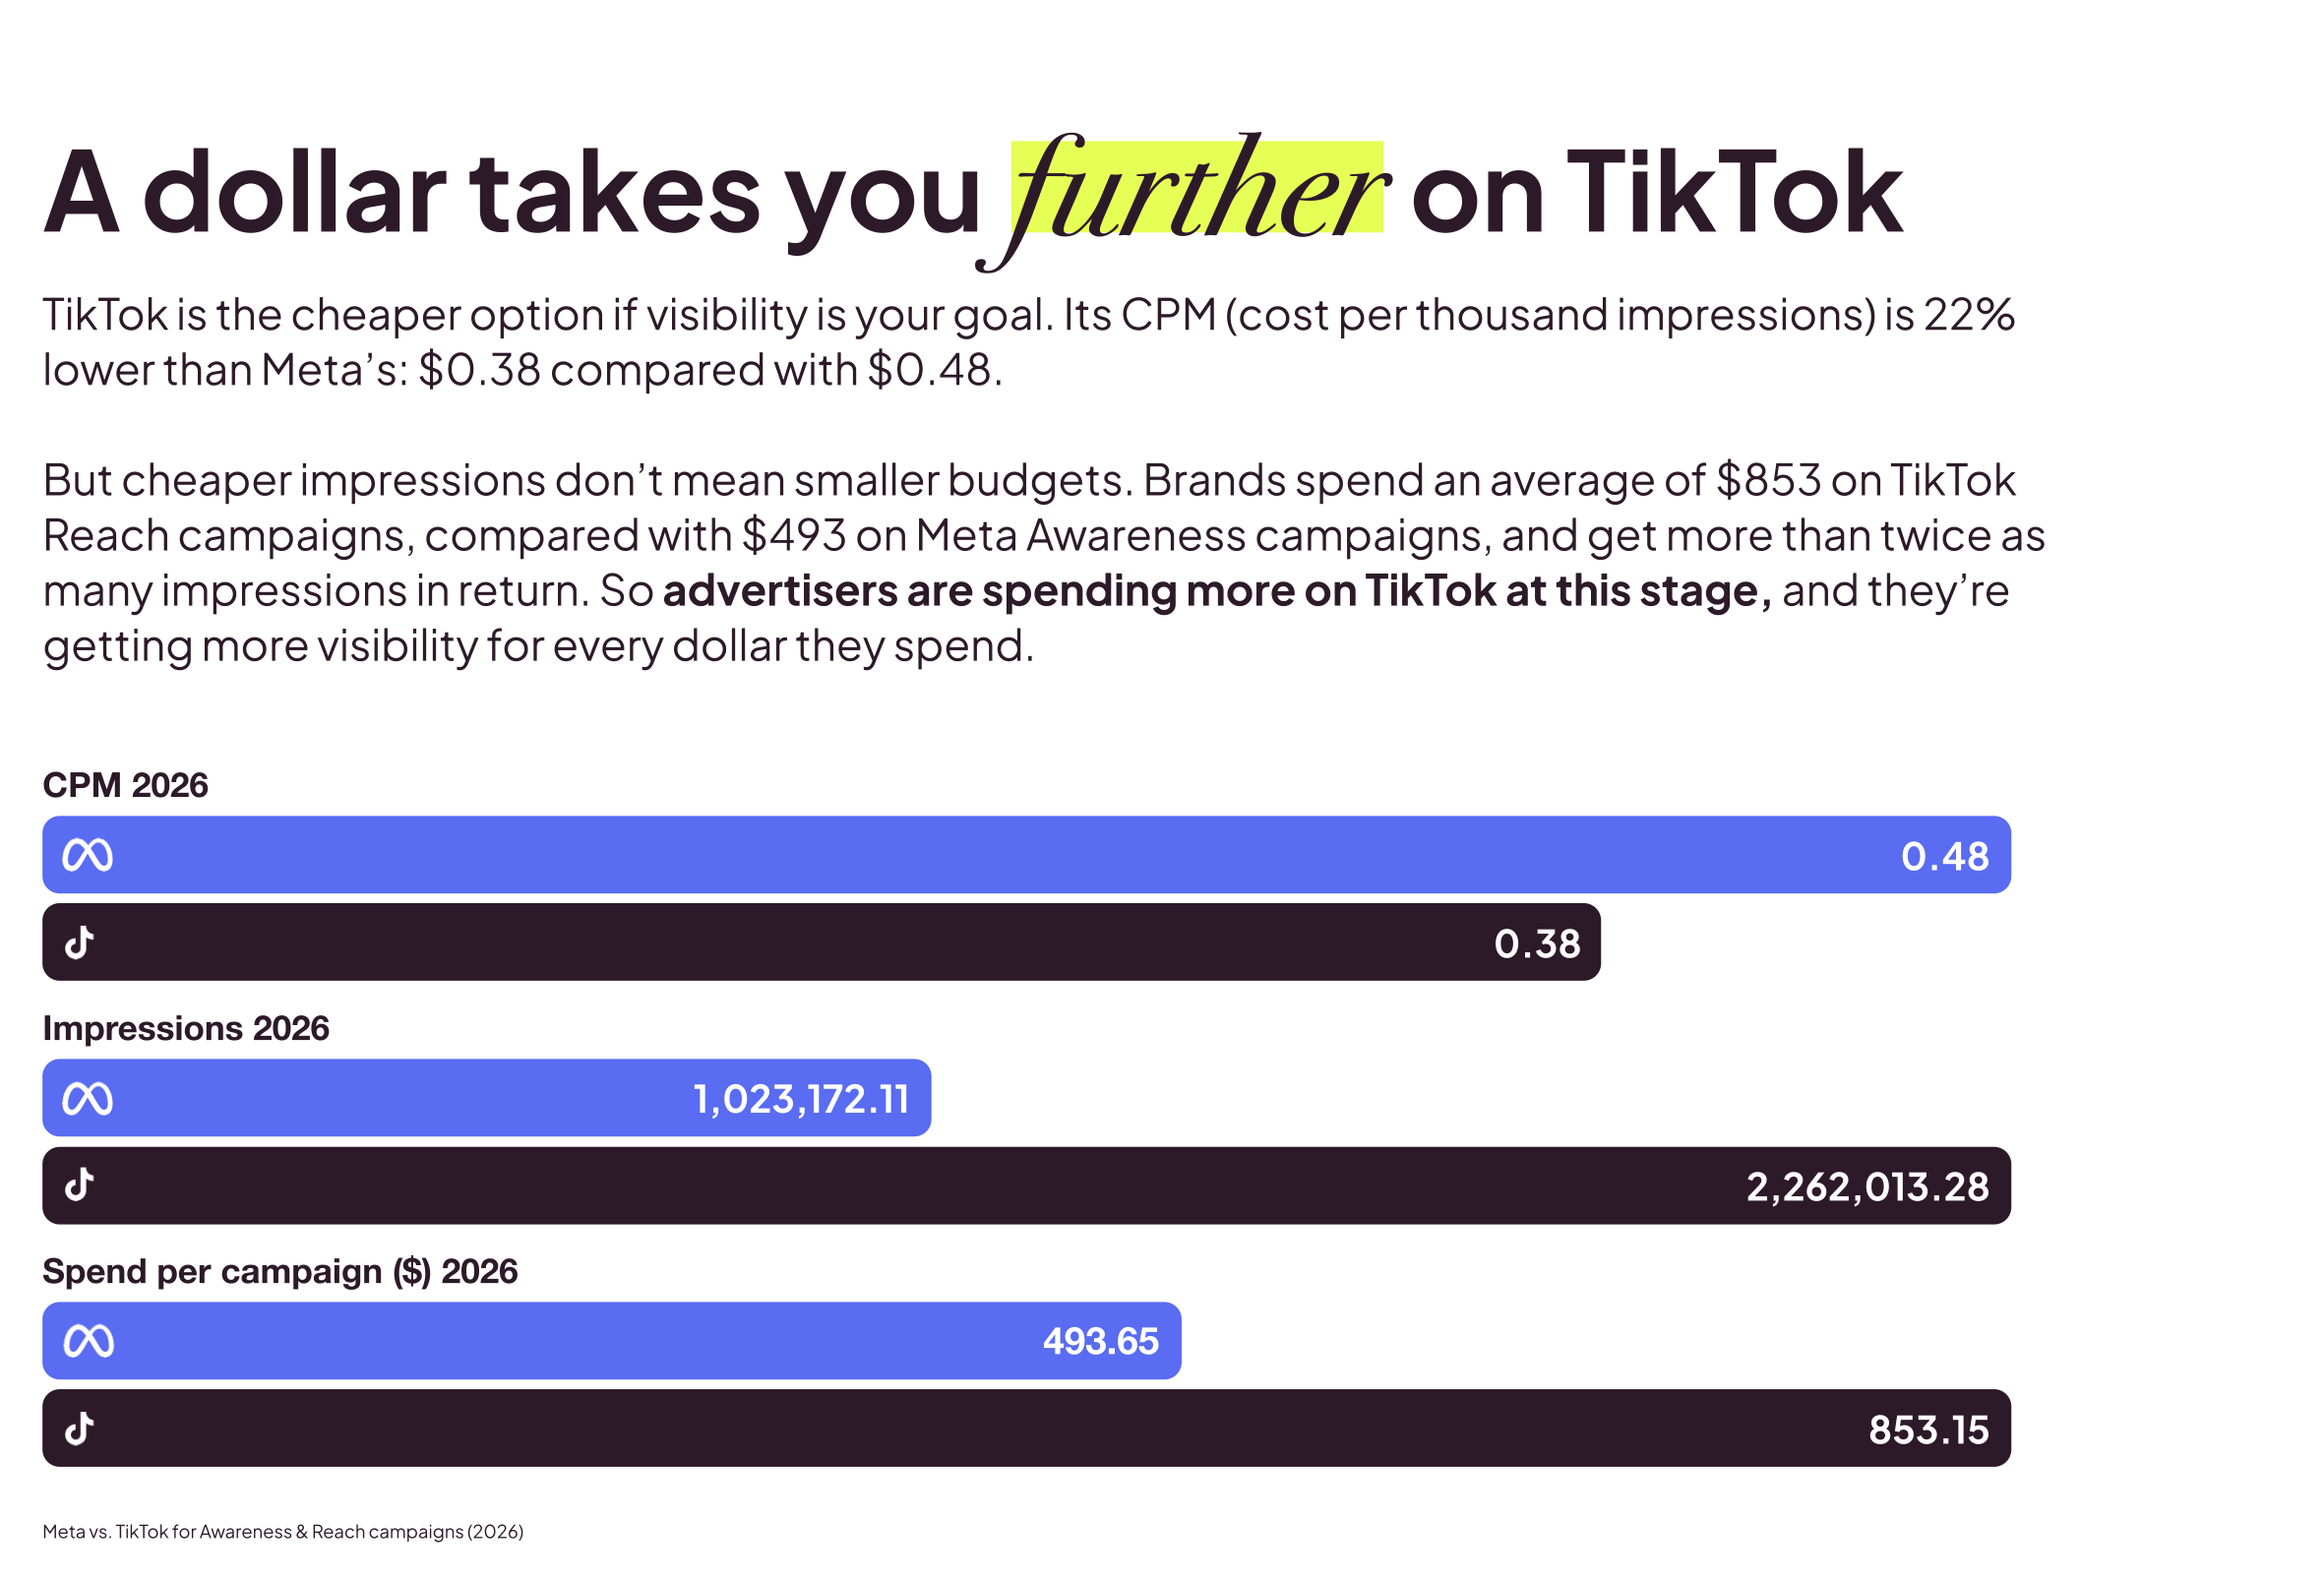
Those numbers are far below anything else we’ve seen.
Triple Whale, tracking 5,900+ mostly ecommerce brands, reports a median Meta CPM of $15.06 and a median TikTok CPM of $4.08. Even Metricool’s own overall Meta CPM across all campaign types is $2.64, five times the awareness figure.
The numbers aren’t made up though; they add up inside the report. Spend divided by impressions gives exactly $0.48. But they probably reflect who is in the sample and how it is averaged:
A geography skewed to cheaper markets. Metricool is a Spanish company, and Latin American markets feature heavily in its data. This is our hypothesis; the report doesn’t publish a country mix.
Objectives optimised for cheap impressions. Awareness and Reach campaigns are built to buy impressions cheaply, which pulls CPM down.
The good news (!) is that the two datasets disagree on levels but agree on direction. Across all campaigns, TikTok’s CPM is about a third of Meta’s in Metricool ($0.90 vs $2.64) and about a quarter of Meta’s in Triple Whale ($4.08 vs $15.06).
Rule for the rest of this article: use the ratios between platforms as your benchmarks, not the absolute prices. They seem to be much closer to reality. Don’t plan your budget on a $0.07 click.
Funnel stage by stage
Awareness: TikTok buys attention more cheaply
TikTok Reach campaigns had a 22% lower CPM than Meta Awareness campaigns ($0.38 vs $0.48).
Advertisers spent 73% more per campaign on TikTok and got 2.2x more impressions.
CPM rose on both platforms year over year: 8% on Meta and 5.5% on TikTok.
Trust: medium.
Two vendor datasets agree that TikTok impressions are cheaper, even though they disagree on the price.
Verdict: for reach, TikTok first.
Traffic: TikTok again, by a wide margin
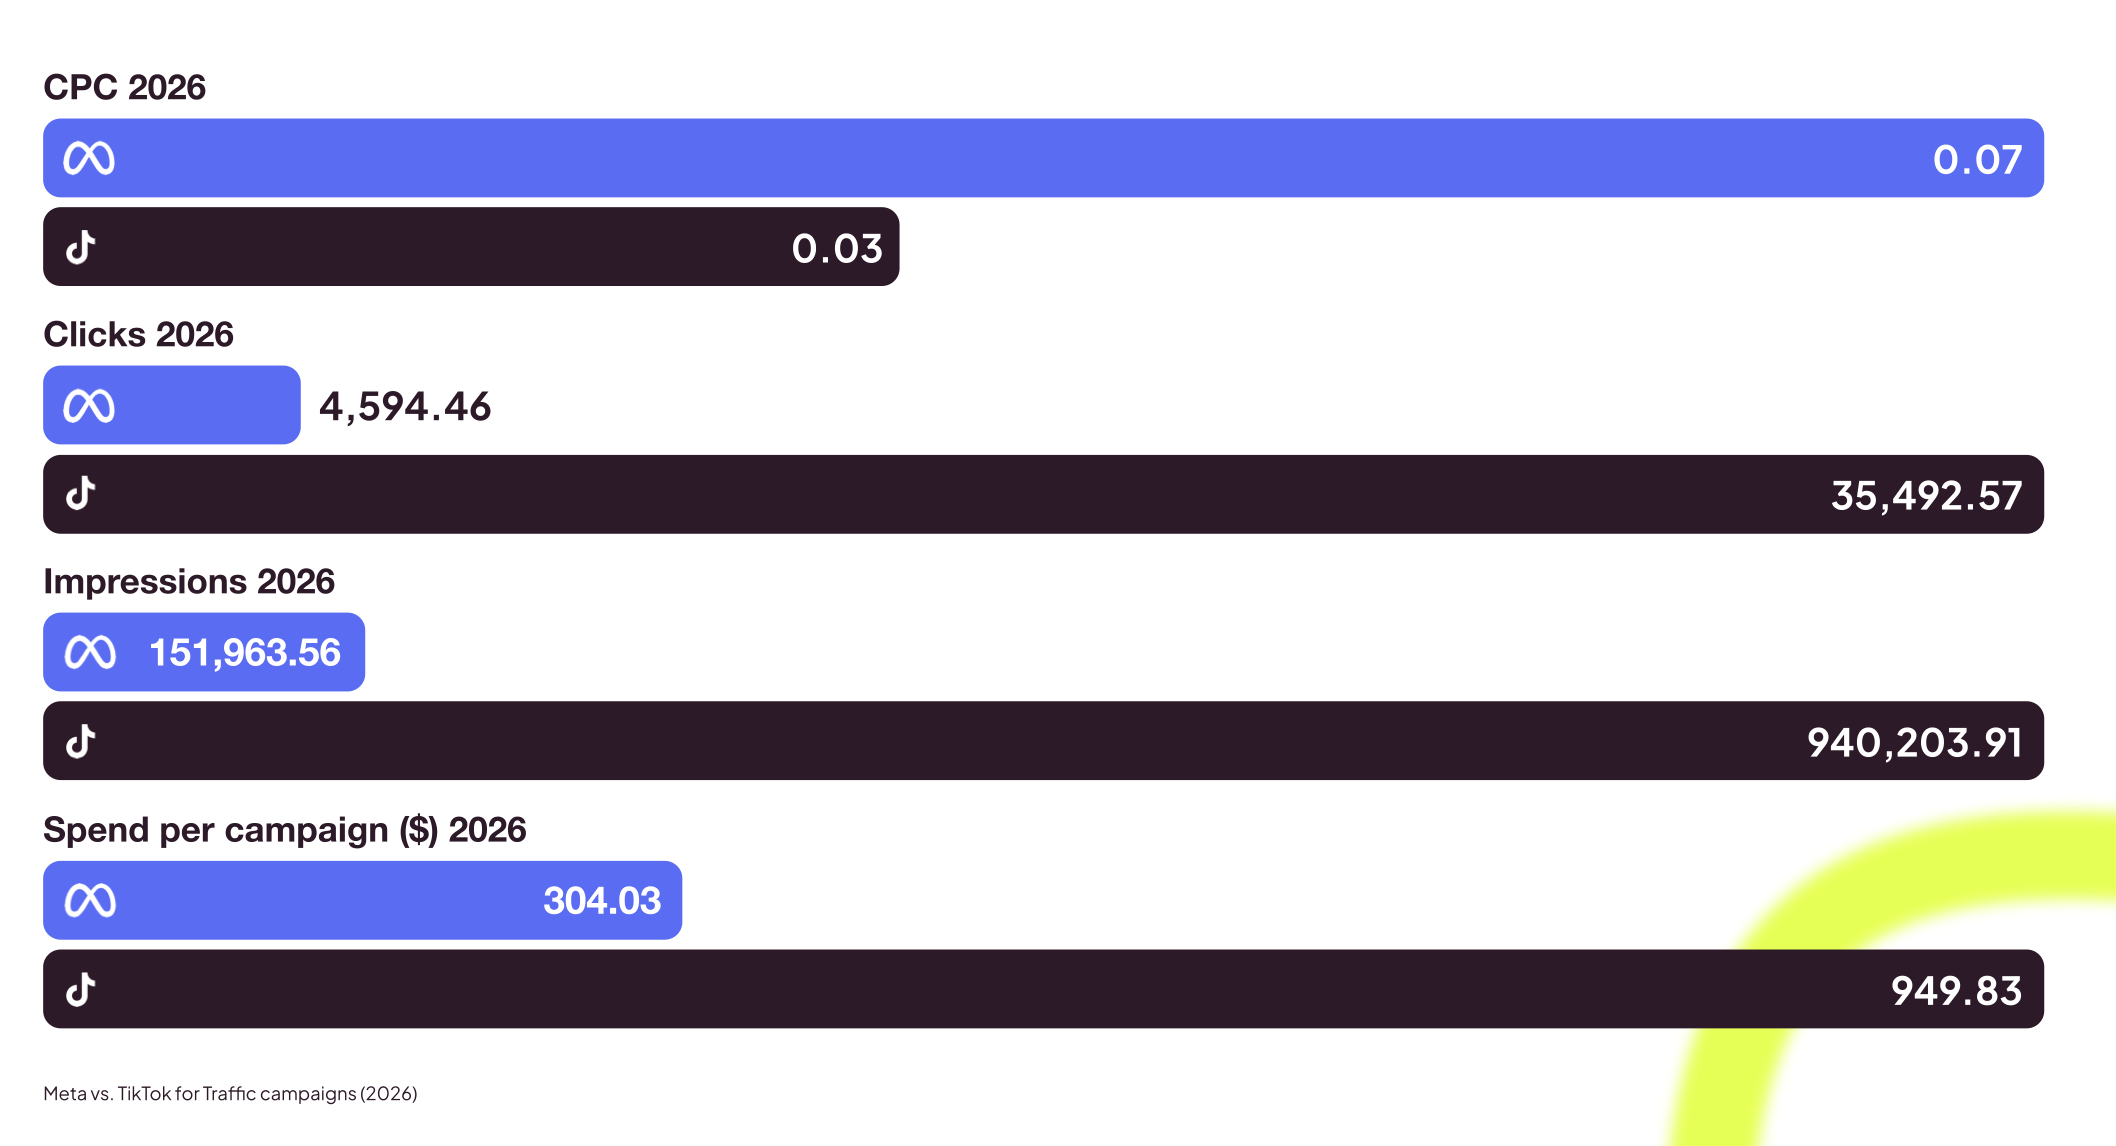
TikTok traffic campaigns paid less than half per click ($0.03 vs $0.07).
They got about 7.7x more clicks per campaign, on roughly 3x the budget.
Clicks got more expensive on both platforms: CPC rose 29% on TikTok and 15% on Meta.
Trust: low to medium.
This rests on one source, and the absolute CPCs are not realistic. Treat it as “TikTok clicks are roughly half the price”.
Verdict: if your goal is cheap visits, test TikTok. Then check what those visitors do on your site, because a cheap click is only a win if it turns into something.
Engagement: Meta’s one clear win
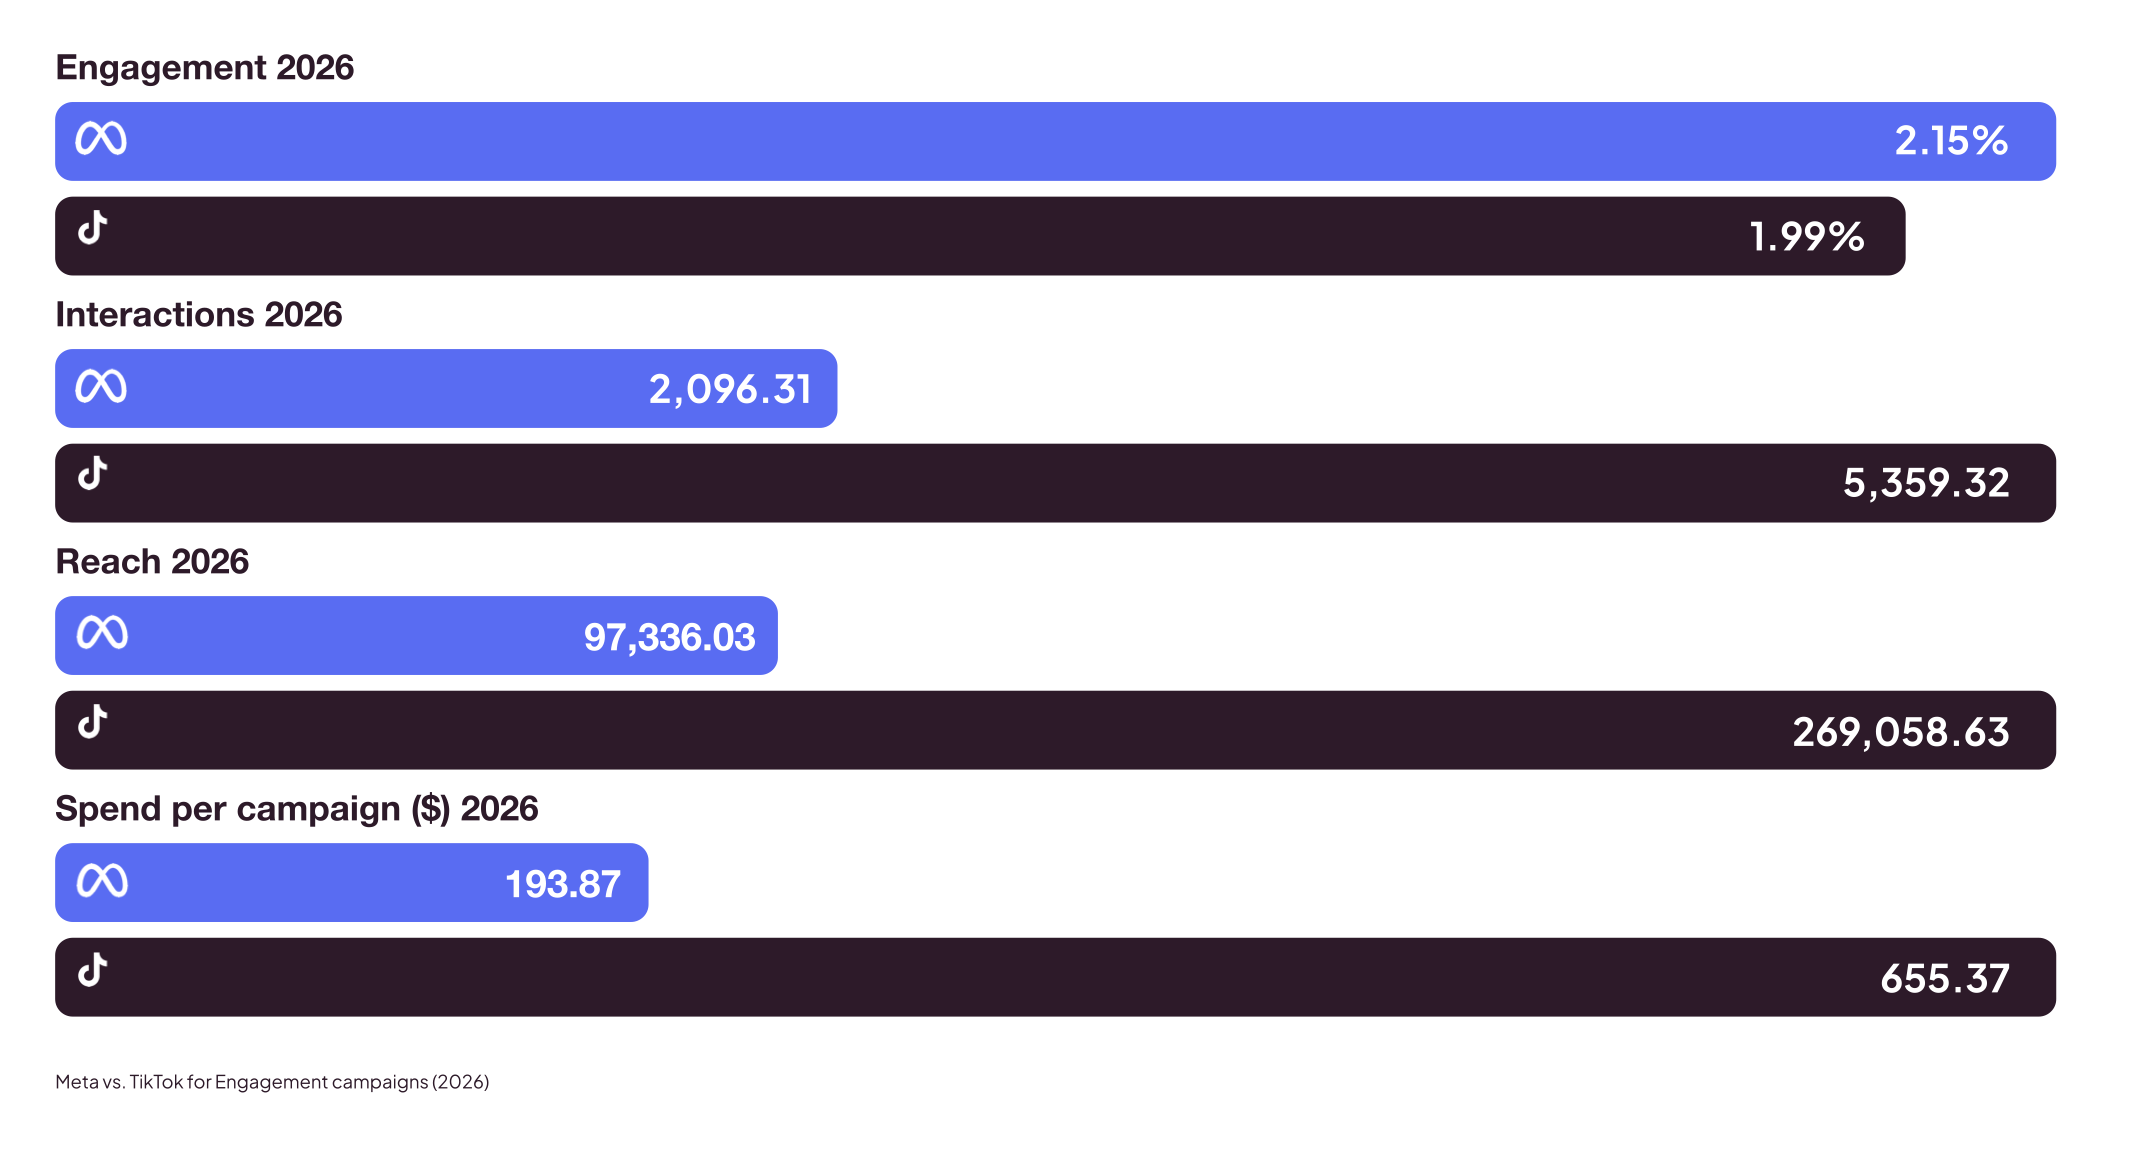
Meta engagement campaigns reached a slightly higher engagement rate (2.15% vs 1.99%).
With about a third of TikTok’s budget per campaign, Meta earned 10.8 interactions per dollar vs 8.2 on TikTok.
Trust: medium.
The data are observed, and the gap comes from how much is spent per campaign, not from rounding.
Verdict: for community building, social proof and retargeting pools, Meta gives more per dollar.
Leads: TikTok looks stronger, but check the leads
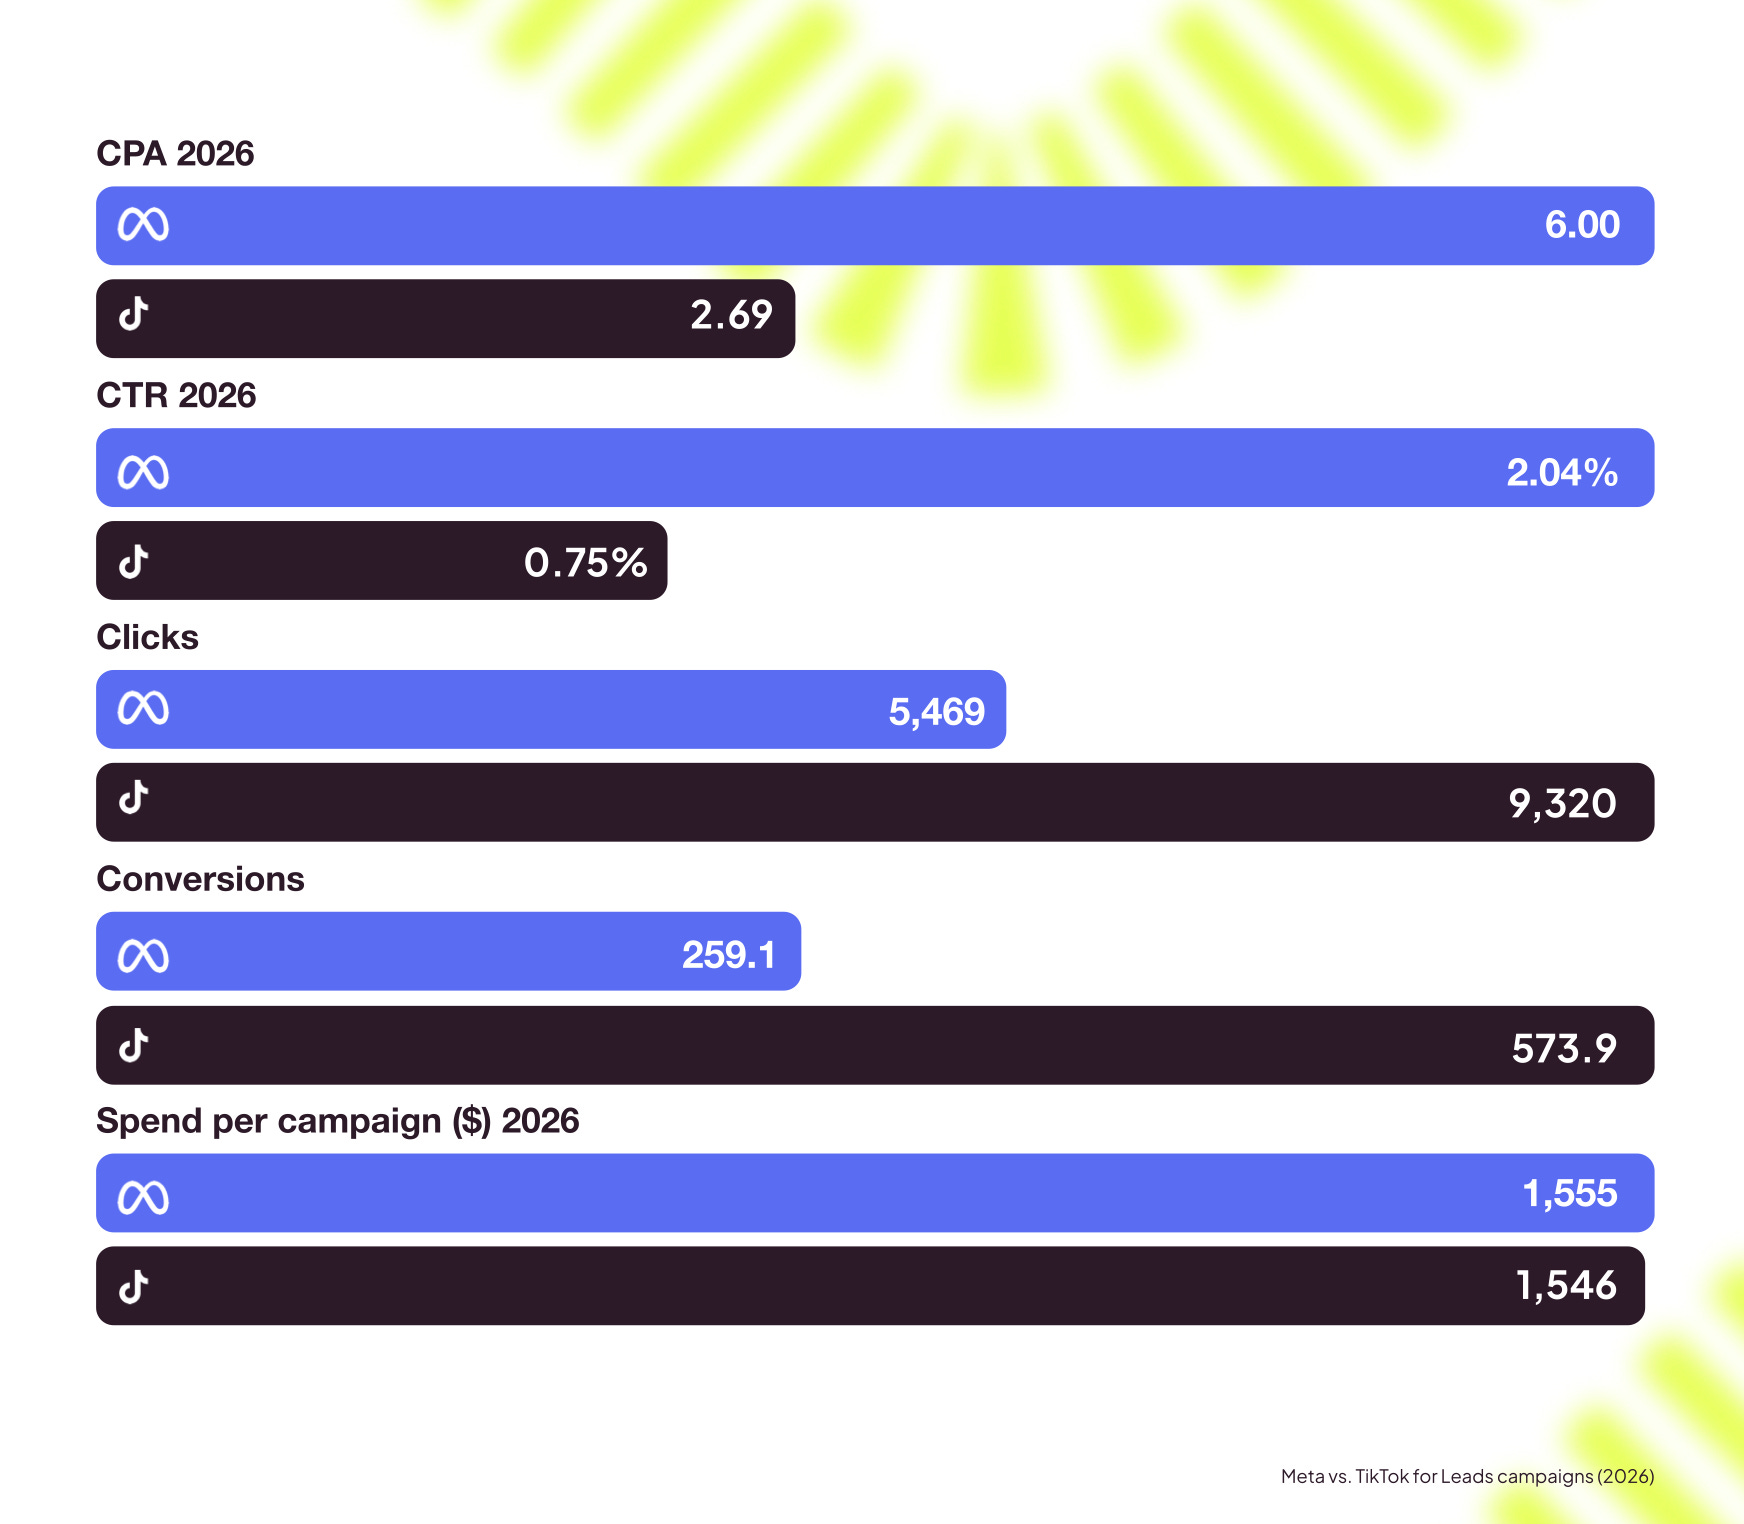
TikTok lead-gen campaigns paid $2.69 per lead vs $6.00 on Meta.
TikTok’s cost per lead fell 33% year over year, while Meta’s rose 14%.
Spend per campaign was almost identical (~$1,550). TikTok produced 2.2x more leads and converted about 6.2 leads per 100 clicks vs 4.7 on Meta, even though Meta’s click-through rate was higher (2.04% vs 0.75%).
Trust: low to medium.
The data come from one source, and nobody measured lead quality. A lead that never answers the phone is not a lead.
Verdict: for lead generation, TikTok deserves a real test next to Meta. Judge it by cost per qualified lead, not cost per form.
Sales: Meta is the proven option, TikTok is unproven
Metricool reports a cost per purchase of $1.14 on TikTok vs $11.14 on Meta. You can ignore it.
The TikTok number comes from only 297 campaigns, down from 1,093 a year earlier, and the accounts still running them are probably the ones for whom it already works. Metricool itself calls it “a promising signal, not a clear win”.
Meanwhile, Meta’s figure is based on 67,025 campaigns.
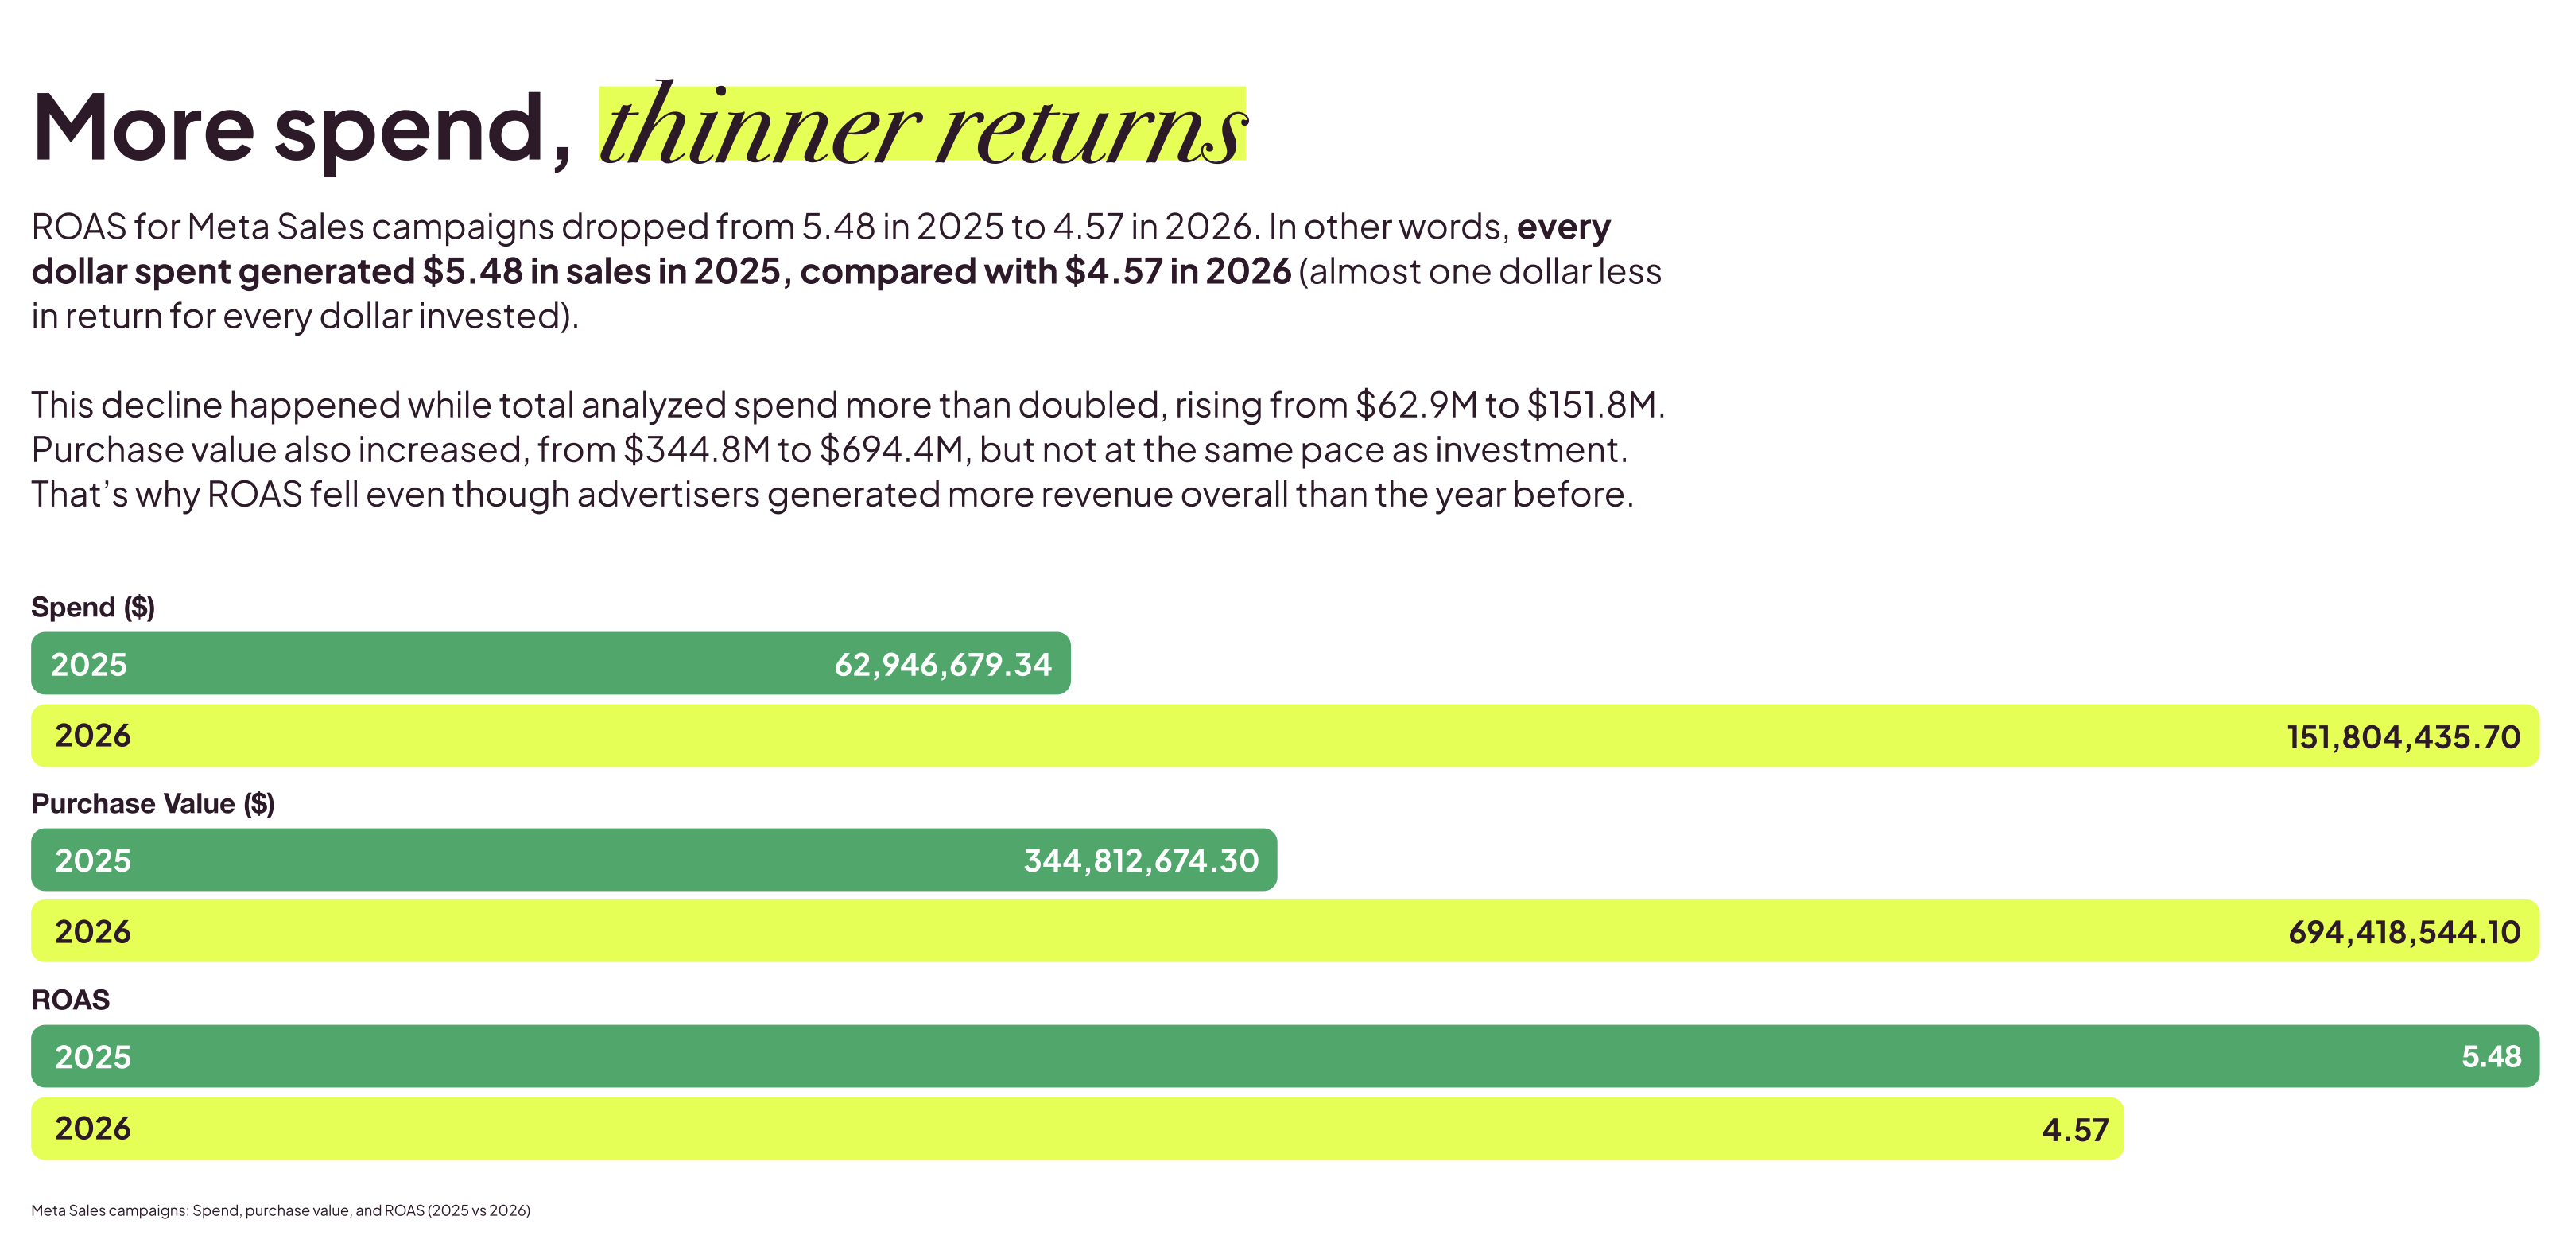
The Meta number that matters is return on ad spend (ROAS). Meta sales campaigns returned $4.57 per $1 spent in 2026, down from $5.48. Advertisers more than doubled spend ($62.9M → $151.8M), but purchase value only roughly doubled.
ROAS fell in every size tier, and the biggest spenders had the lowest ROAS in both years (4.88 → 3.97), below even the smallest accounts. Spending more per dollar did not make the dollars work harder.
Trust: medium for the direction, low for the level.
ROAS is only counted for the ~64% of campaigns that track purchase value, and it is platform-reported, which usually flatters results.
Verdict: Meta stays the default for sales. TikTok sales campaigns are a good test. Expect returns to shrink as you scale.
Where the money actually goes
Advertisers run most campaigns in the middle of the funnel but spend most of their money at the bottom:
Meta: 67% of campaigns target traffic or engagement, yet 70.9% of spend goes to leads, sales and app promotion. Sales alone takes 42% of spend with 11% of campaigns, and awareness gets only 5.8%.
TikTok: the split is more even, but 58.2% of spend still goes to the bottom of the funnel. One in four TikTok campaigns is optimised for video views.
That is rational: the bottom of the funnel is where revenue shows up. It also means most budgets are fighting over the same last click, while awareness, the stage where TikTok is cheapest, is underfunded.
Country matters more than platform averages
Meta sales ROAS swings widely depending on where a brand is based:
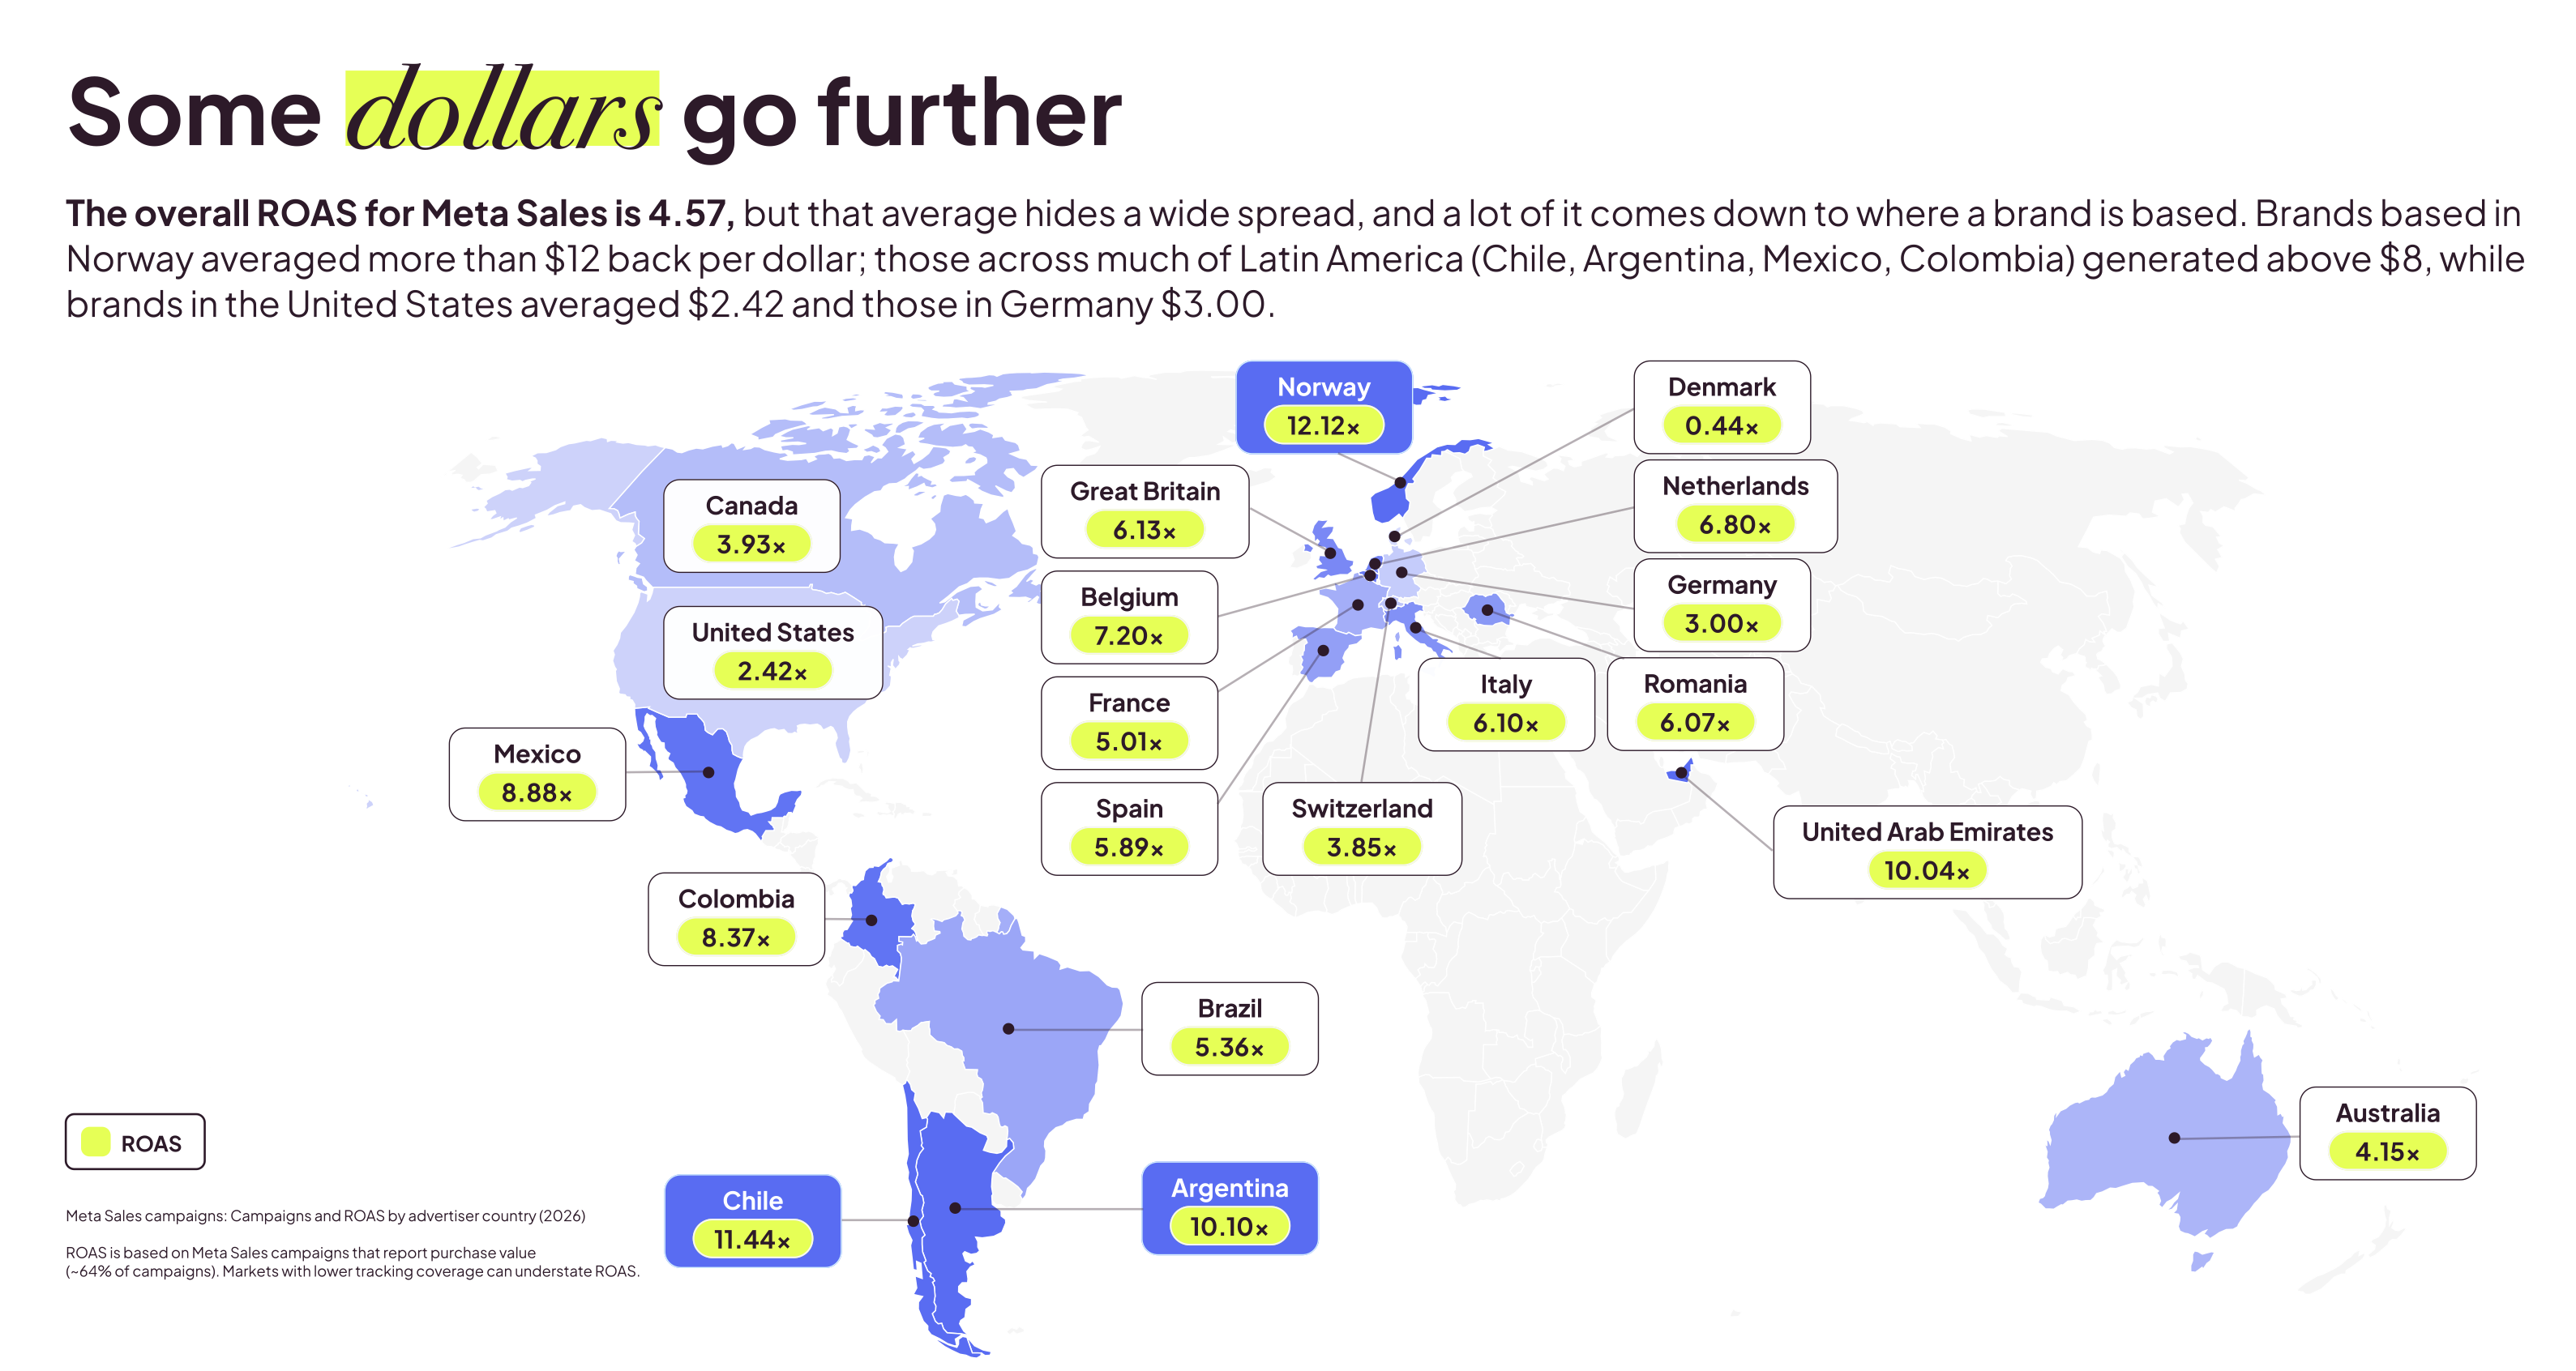
Before you panic about your US ROAS: markets with weaker purchase tracking can look better or worse than they are. The report itself warns that lower tracking coverage understates ROAS.
The practical lesson: the global average (4.57x) is not your benchmark. A US brand hitting 3x on Meta is doing better than average for its market, and a Latin American brand at 5x may be underperforming.
The organic layer: which format where
If you post organically, not only buy ads, Metricool’s Instagram study adds a few useful signals:
Video reach favours TikTok.
Instagram Reels got 29.9% fewer views and 41.9% less reach than TikTok videos.Carousels favour Instagram.
Instagram carousels got 372% more views than TikTok carousels, and 142% more reach than single-image posts on Instagram.Hashtags didn’t help.
Instagram posts with hashtags got 32% fewer views.Asking works.
Posts with a call to action got 203% more comments, and posts that ask a question averaged 55.7 comments vs 40.7.
Trust: medium-low.
These are observed data from a vendor’s user base, and they show correlation, not cause.
Recommended read:
Research: The best performing hooks and creatives on Meta (Instagram + Facebook)

Five key facts to grab your attention first
The playbook
Reach and awareness → TikTok
Expect CPM about 20% lower on like-for-like objectives, and up to 3–4x lower overall. Confidence: medium, since two datasets agree.Website traffic → TikTok
Expect a CPC about half of Meta’s and far more clicks per campaign. Confidence: low to medium, one source.Engagement and community → Meta
Expect about 30% more interactions per dollar. Confidence: medium.Lead generation → test both
Expect TikTok’s CPL to be about half of Meta’s, with lead quality unknown. Confidence: low to medium.Sales → Meta
Expect ROAS to keep falling year over year, and to fall further as you scale. Confidence: medium.Sales on TikTok → a small test only
There is no reliable benchmark yet (297 campaigns). Confidence: low.Organic video → TikTok
Expect more views and reach than Reels. Confidence: medium-low.Organic carousels → Instagram
Expect many more views than TikTok carousels. Confidence: medium-low.
How to test before you commit
Pick one goal per test
Comparing a TikTok traffic campaign with a Meta sales campaign tells you nothing, because cost per result depends on the objective.Split a fixed budget 50/50 for 4 weeks
Use the same offer and the same creative idea, adapted natively to each platform.Measure one step past the platform’s number
For traffic, measure on-site conversion.
For leads, measure qualified leads or booked calls.
For sales, use your own revenue data, not platform-reported ROAS.Benchmark against your market, not the global average
Use the country table above as a rough guide.Scale carefully
The biggest Meta spenders get the lowest ROAS.
Raise budgets step by step and watch marginal returns.
What we’d expect, and what would change our mind
If you’re an early-stage brand with a small budget, the evidence points to a simple split: TikTok for cheap attention, traffic and lead tests; Meta for engagement and proven sales. Expect TikTok to win on cost per impression and click, and Meta to win on predictability at the bottom of the funnel.
Stacy’s Brain grades marketing research so your budget decisions rest on evidence, not hype. Every number in this article links back to a graded source in our library that will go live soon.
Stay tuned!