

Five key facts to grab your attention first
Only about 5% of Meta ads become winners. Roughly half get little or no spend at all.
Volume, not intuition, is what finds winners. Advertisers testing 2.8 ads a week hit 4.03%; those testing 18.85 a week hit 8.80%.
Cheap formats win more often than expensive ones. Text-only assets had the highest hit rate (11.6%) and took nearly twice their share of budget (1.97x), while high-production assets took less than their share (0.79x).
The format that travels best across industries is the plain “letter” ad — it lands in the top 10 by hit rate in 10 of 15 industries.
Industry beats benchmark. Street interviews hit 30% in automotive and don’t make the top 10 in most other industries. Industry-specific insights are the key.
Now, let’s start our creative journey
What this study is built on:
Creative Benchmarks 2026, Motion — 550K+ Facebook and Instagram ads from 6K+ advertisers, about $1.3B in spend, launched between September 2025 and early January 2026.
Vendor interest: high. Motion sells creative analytics, and the report’s conclusion (”test more”) is also its sales pitch.ViASNet: A Video Ad Saliency Network (arXiv, May 2026) — 151 video ads, each watched by about 20 people with eye tracking.
Academic, no vendor interest, but small sample.The 2026 State of Marketing, HubSpot — survey of 1,500+ marketers.
Vendor interest: high. I use it only to analyze what marketers believe.
A couple of side notes so you can interpret the data below
Motion calls an ad a winner when it spent at least 10x its account’s median ad spend. In other words a “winner” here means an ad the platform spent heavily on, not an ad that made money.
Hit rate is the share of ads in a group that became winners. So “high hit rate” reads as: when advertisers made this kind of ad, the it got scaled more often than average.
Pls note:
We don’t have data on the actual revenue advertisers generated from their winning ads, but we assume that if they scaled spend on those creatives, they outperformed the other creatives they tested.
The uncomfortable truth about base rate
About 5% of ads reach winner status, and roughly half get little or no spend.
The share of winners also rises with budget: 3.7% at micro advertisers (under $10K a month) against 8.2% at enterprises ($1M+). The interpretation of “big teams make better ads” is actually misleading; the data suggests something duller:
Micro advertisers test 2.8 ads a week and hit 4.03%. Enterprises test 18.85 a week and hit 8.80%.
Enterprises put 63.7% of monthly spend behind winning ads. Micro advertisers put 23%, and 31.5% of their spend goes to ads classed as losers.
More tests mean more chances for the algorithm to find something to scale — and a bigger share of budget ends up behind the ads that work.
That is correlation, not proof: bigger budgets buy both more tests and more spend per test. But if you are choosing between polishing one more ad and shipping two more variants, lean towards shipping.
Visual formats: what gets scaled
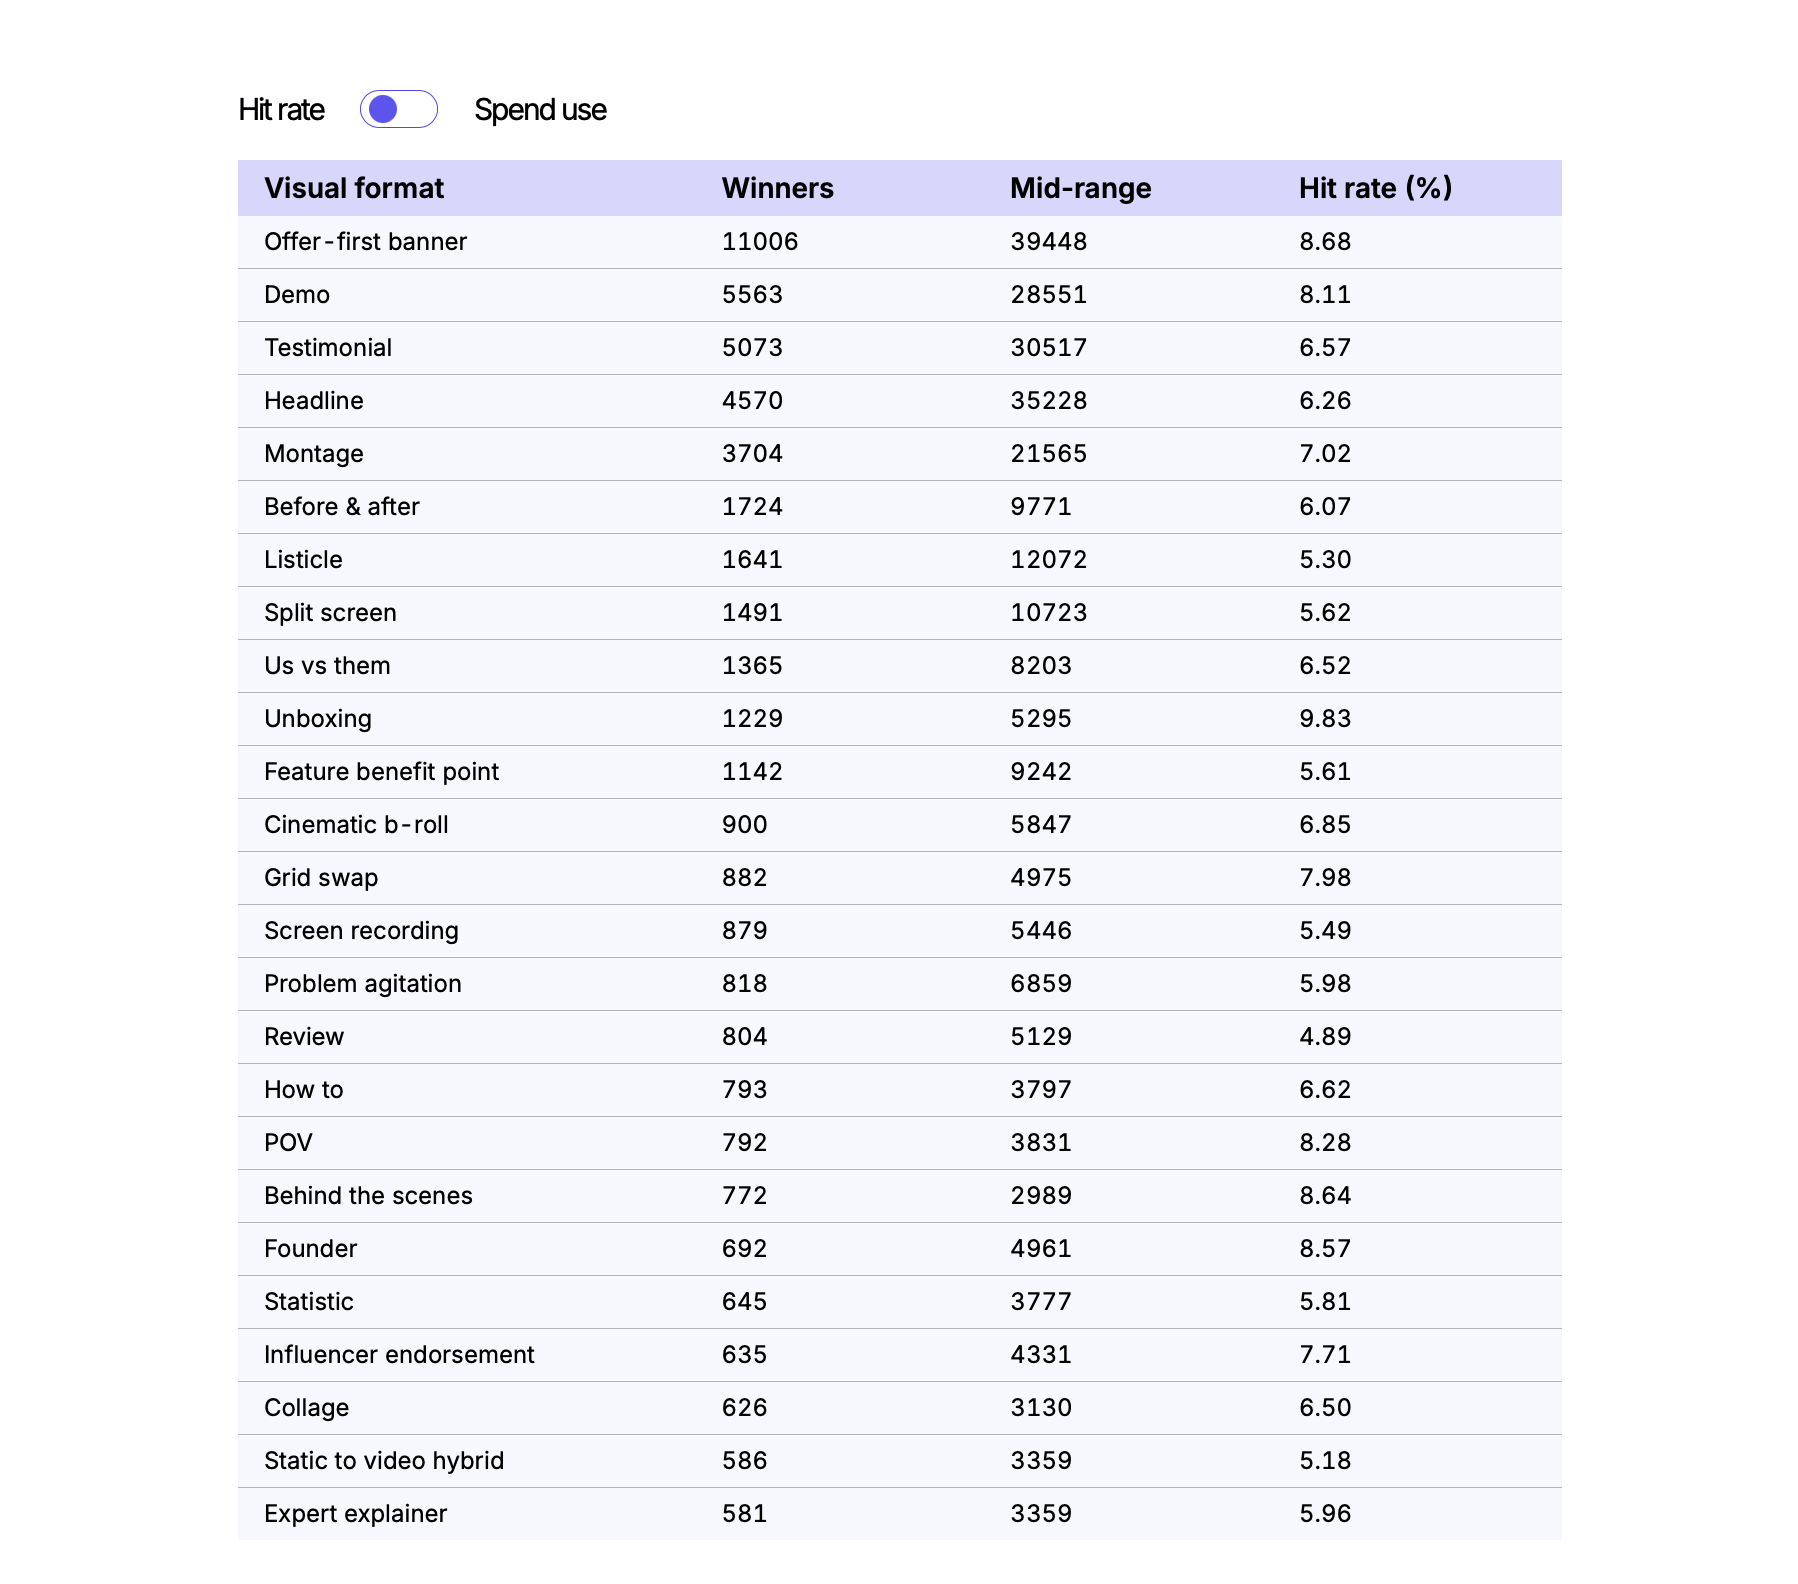
Across all industries, the highest hit rates by visual format were:
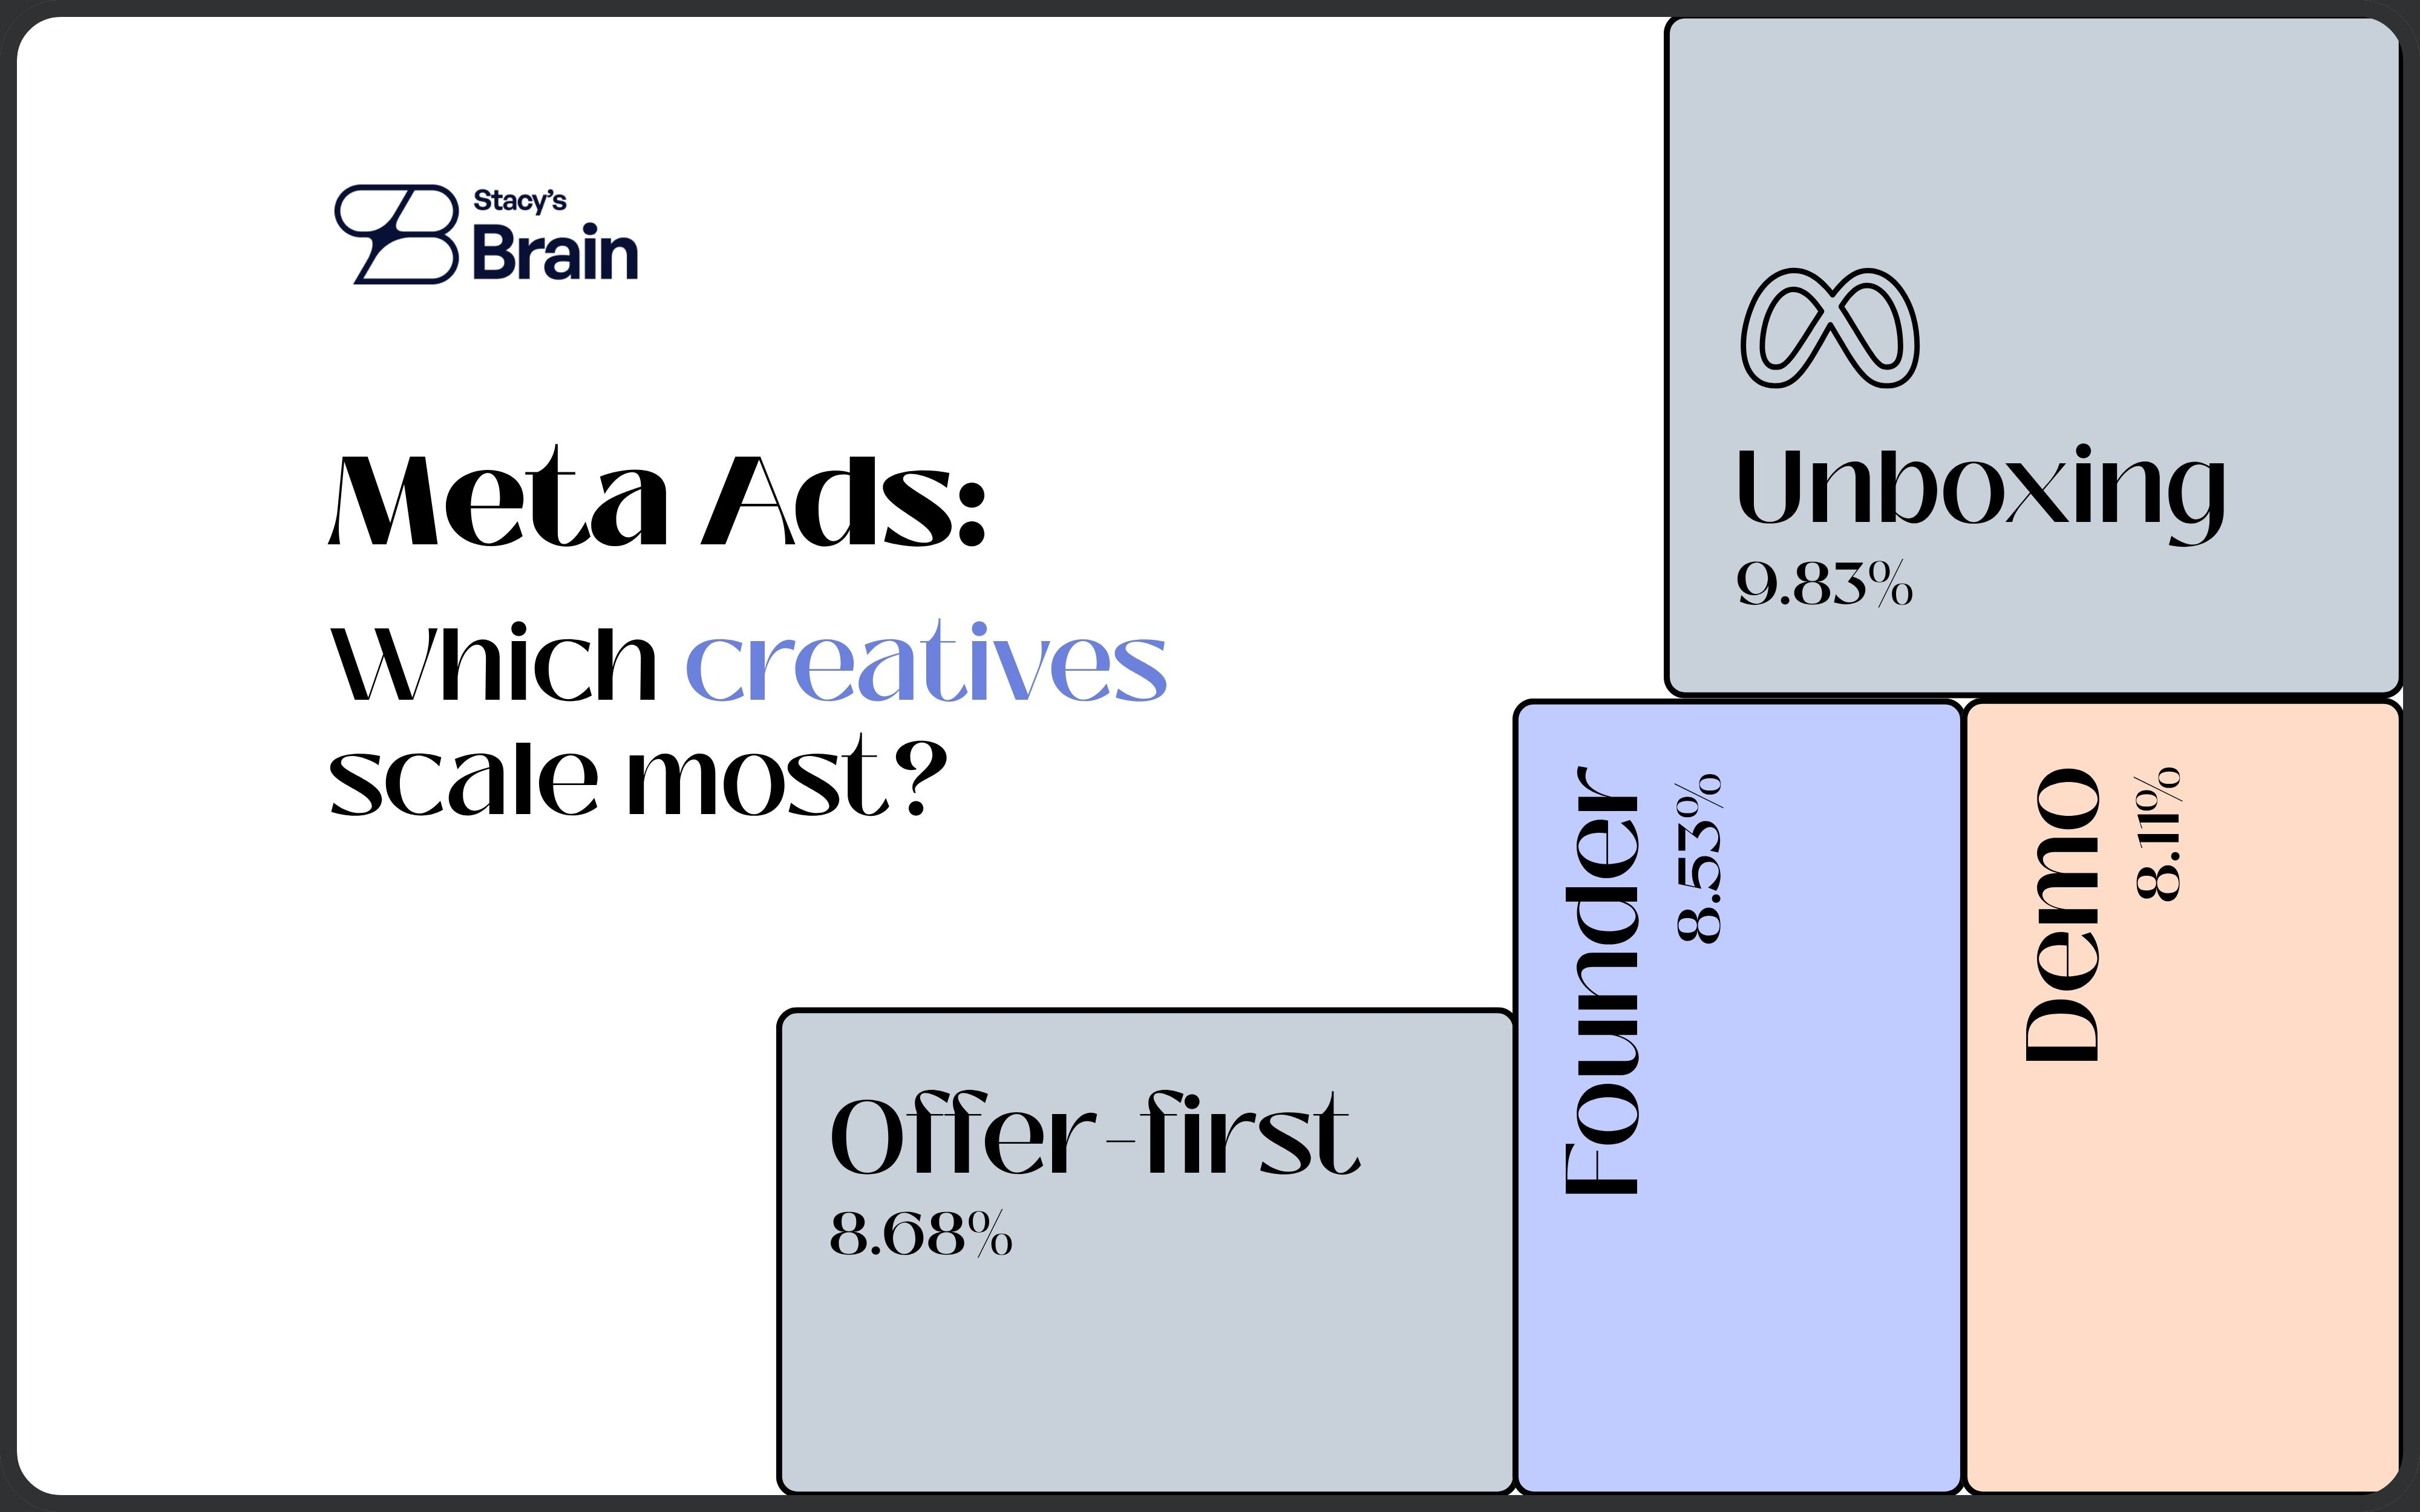
Unboxing — 9.83% (1,229 winners)
Offer-first banner — 8.68% (11,006 winners, by far the most in absolute terms)
Behind the scenes — 8.64%
Founder — 8.57%
POV — 8.28%
Demo — 8.11%
Two highlights:
Offer-first banners and demos are used constantly, and they produce most winners in absolute numbers.
Unboxing, behind-the-scenes and founder ads are the high-percentage plays: used far less, but they scale more often per attempt.
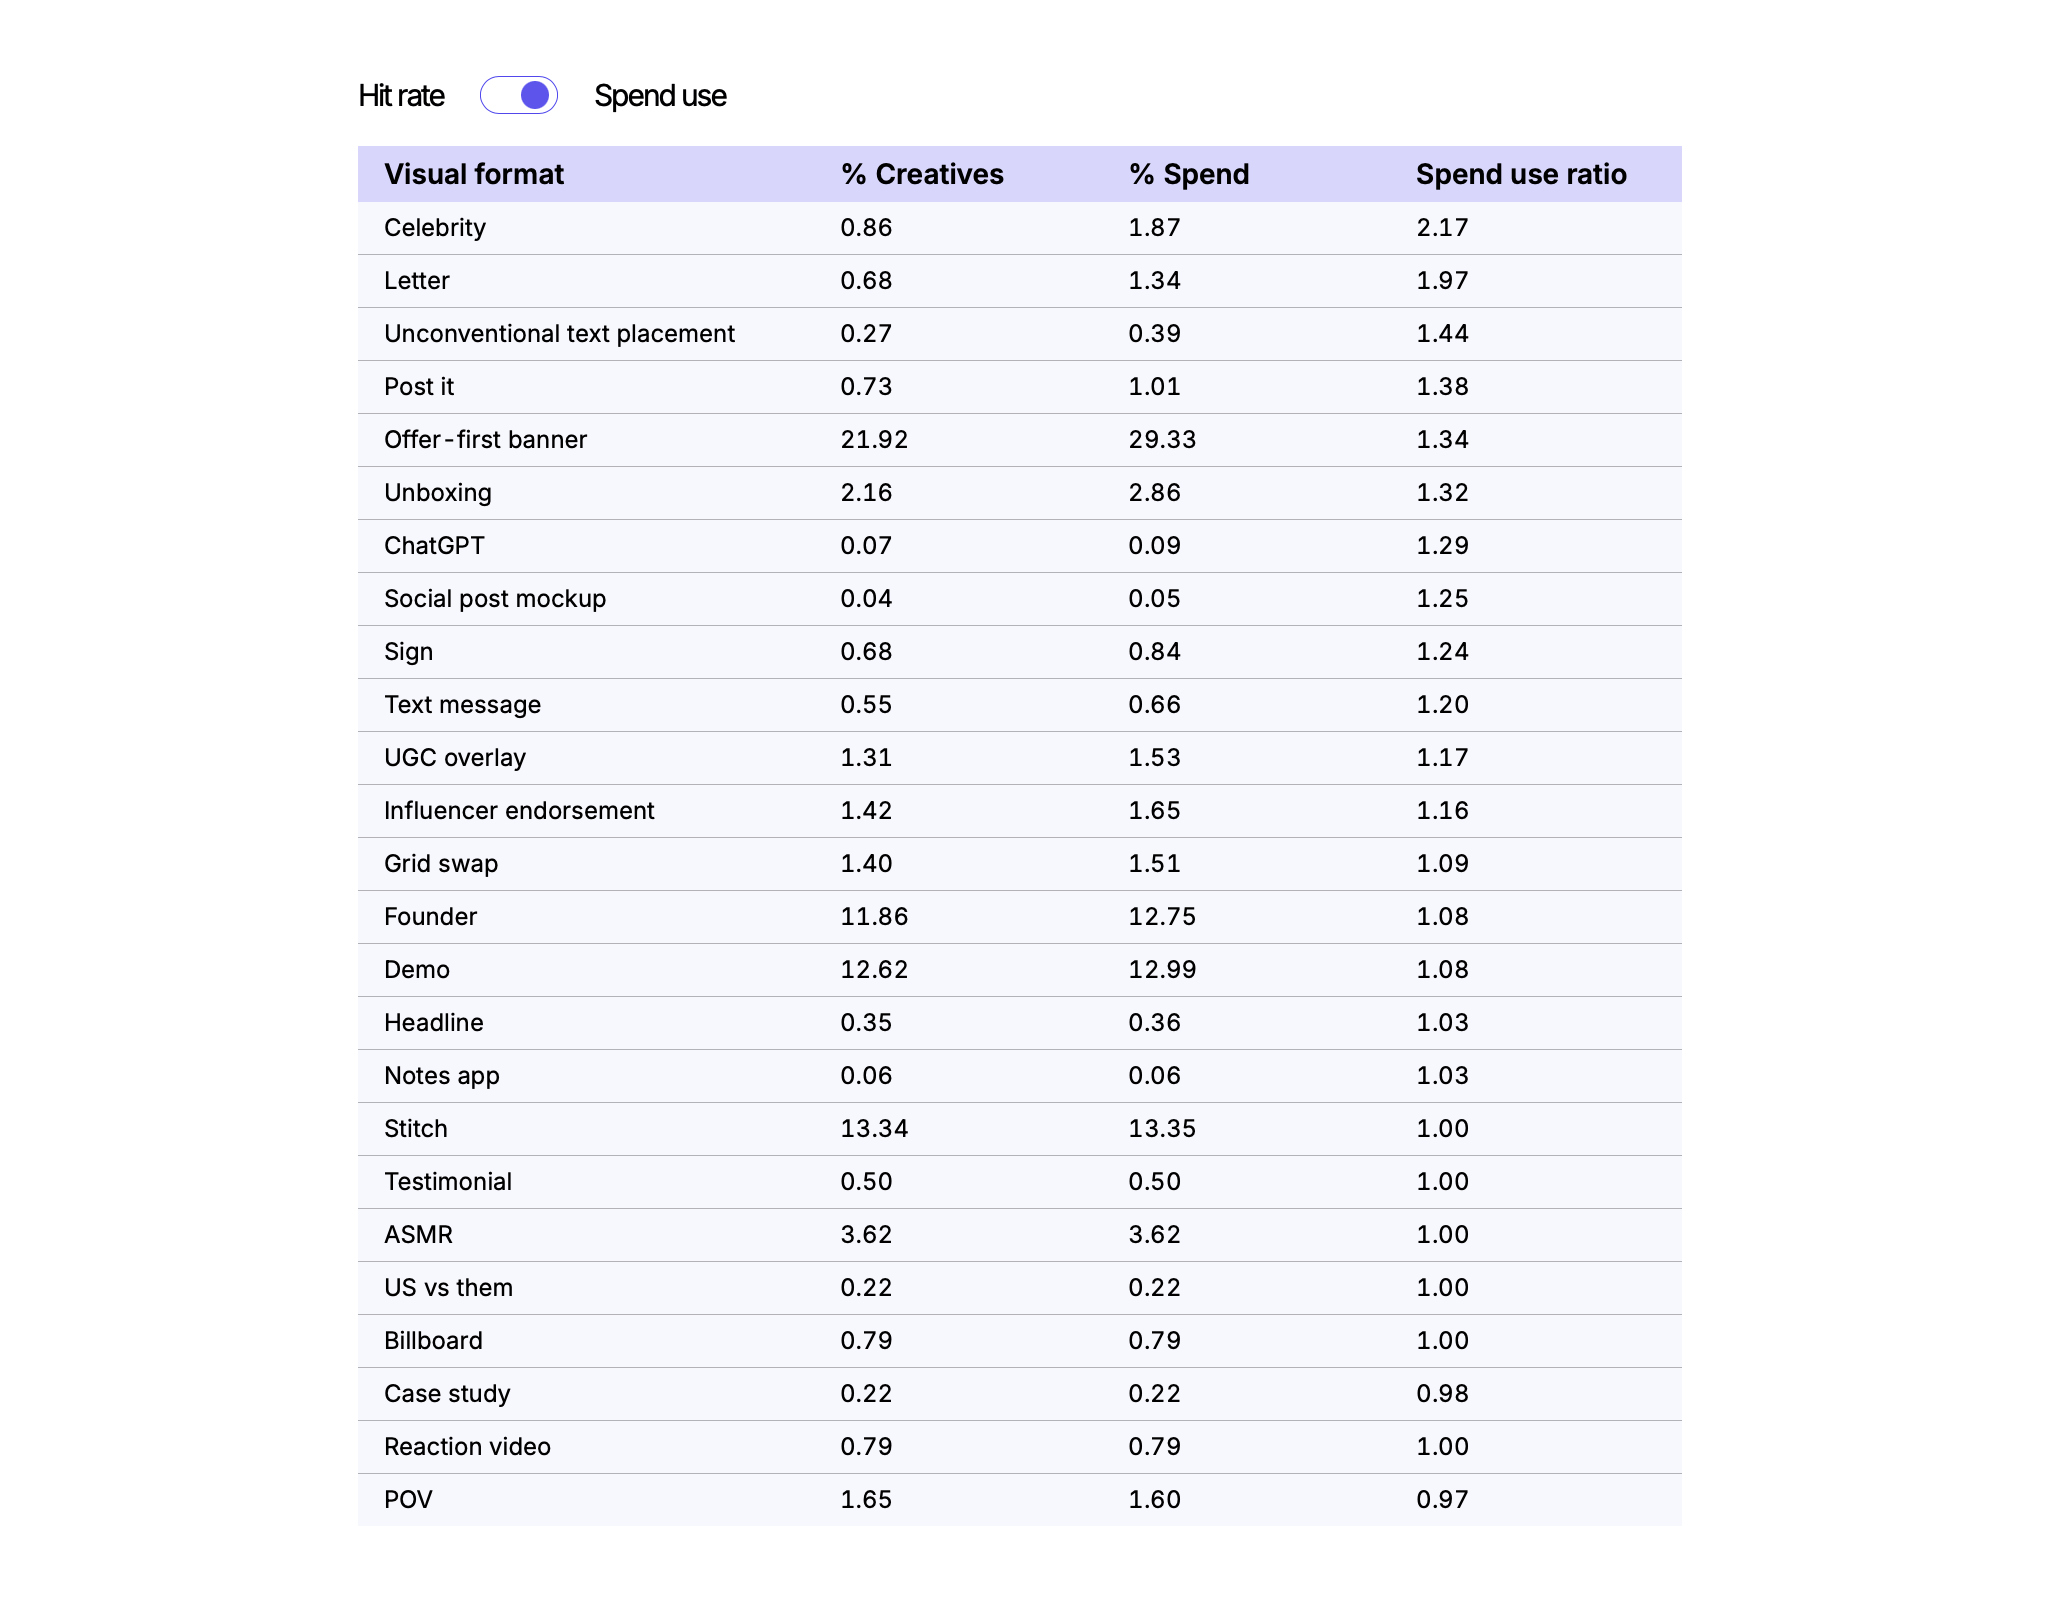
Though, budget follows a different logic. It is measured by spend use ratio — share of budget divided by share of ads.
In other words:
Imagine you have $10K and launch 100 different creatives. Five of those creatives are text-only and get $1K of your budget. That means their spend ratio is 10% / 2% = 5x.
The formats that got disproportionately more money were celebrity (2.17x) and letter-style ads (1.97x), while offer-first banners took only 1.34x.
Asset types: production complexity doesn’t matter
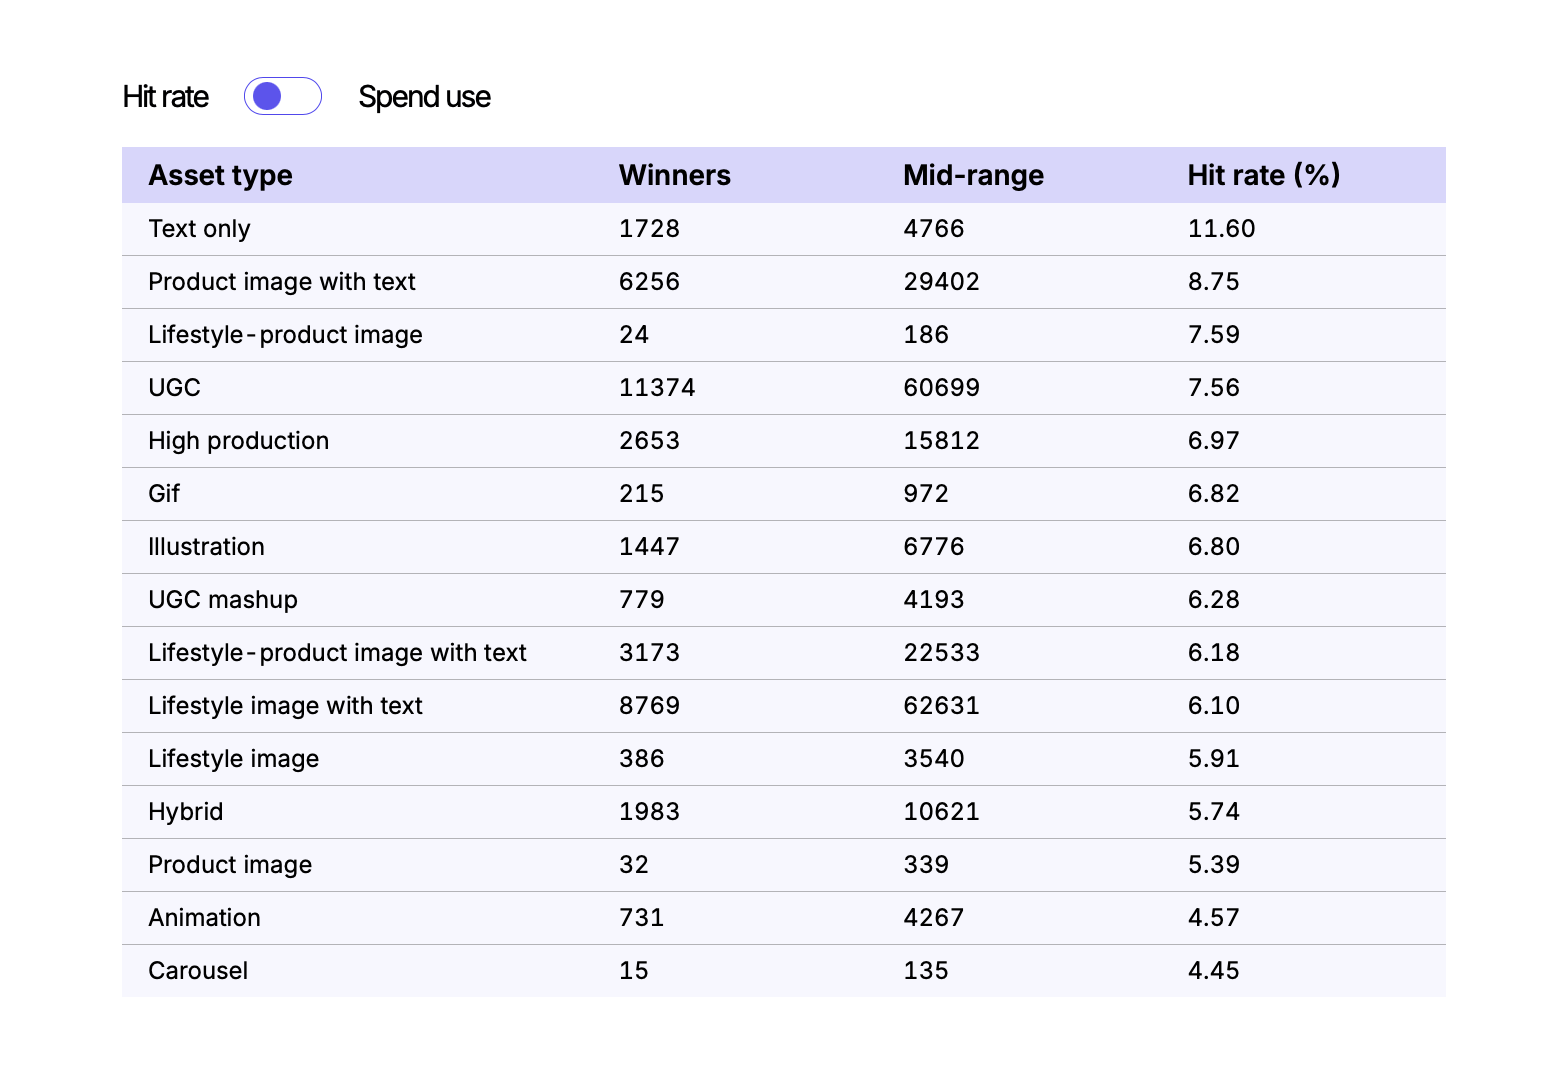
In our opinion this is the most actionable part of the report, because it is the part that costs money. Let’s see what types of creatives got the best hit rate:
Text only — 11.6% hit rate, the highest of any asset type, from just 2.57% of creatives.
Product image with text — 8.75%.
UGC — 7.56%, and the most winners overall (11,374), because it is also the most used asset type (26% of creatives).
High production — 6.97%.
What does that mean?
Text-only assets took 1.97x their share of spend, product images with text 1.23x, UGC exactly 1.00x, and high production 0.79x — less than its share of creatives.
So the cheapest thing you can make — a text card — was both the most likely to scale and the most over-funded relative to how often it was used. Speed of production is the hidden variable: assets you can make in an hour get made, tested and replaced far more often.
Margin note: in the report we’re reviewing text-only is 2.57% of all creatives. Since it’s used rarely it can look great on a rate and still be fragile at scale. Treat it as a cheap bet worth testing though.
Hooks: what you say in the first line
Highest hit rates by hook headlines:
Newness — 11.37% (83 winners)
Sale announcement — 11.35% (16 winners — based on a very small base)
Price anchor — 10.89% (71 winners)
Urgency — 9.73% (4,855 winners)
Offer only — 9.29% (4,798 winners)
FOMO — 9.20%, confession — 8.74%, exclusivity — 8.44%
And the tactics that produced the most winners in absolute terms: urgency (4,855), offer only (4,798), relatability (3,377), curiosity (2,402), and bold claim (2,308).
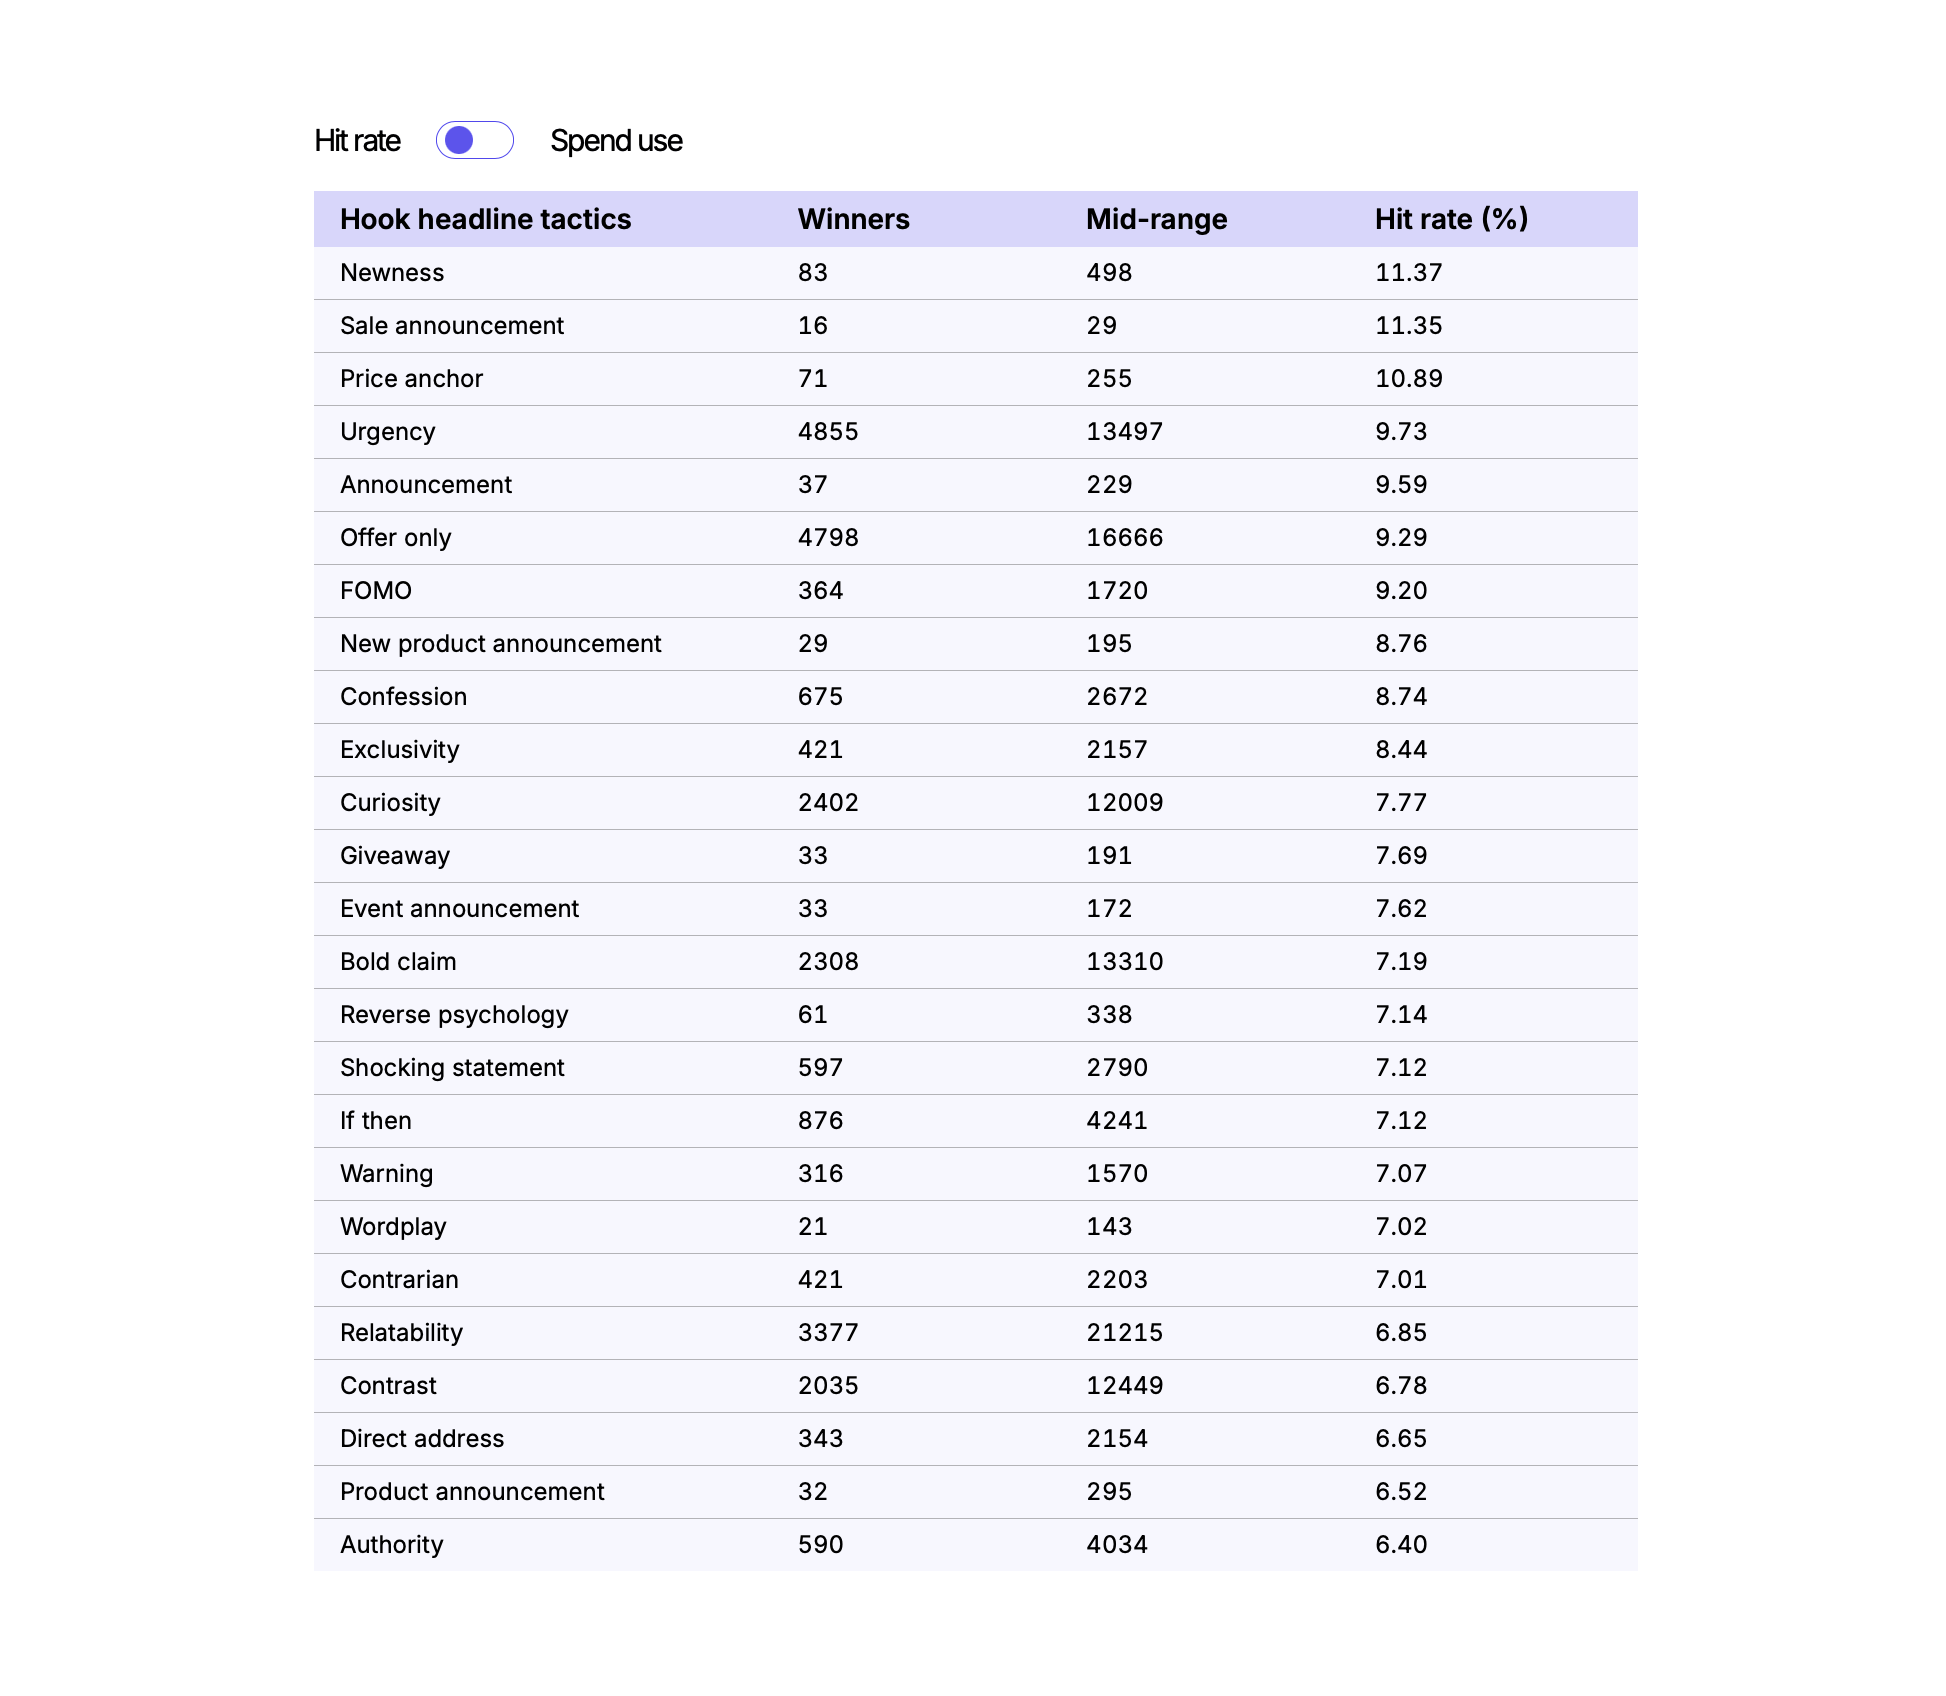
Notice which hooks sit near the bottom on rate while still being everywhere: relatability 6.85%, contrast 6.78%, authority 6.40%. These are the “brand voice” hooks. They are used heavily and scale less often than others.
There’s another important margin note here. The sample runs September to early January: Black Friday, Cyber Monday and the holiday run-up. That window flatters every offer-led and urgency-led hook in the list. So please read this seasonally and don’t extrapolate findings to any other campaign period automatially.
The details: What are the winning creatives by industry?
Now you know which creative types worked well for an average brand — but there’s no guarantee they’ll be top performers in your industry.
Luckily, we have some data from the report. Here are a few examples of the top formats by hit rate:
Automotive: street interview — 30.0%
Fashion & apparel: post it — 27.4%, quiz — 25.99%
Pets: nostalgia — 26.09%, unconventional text placement — 20.93%
Parenting & family: unboxing — 25.53%, expert explainer — 25.0%
Home & lifestyle: reaction video — 22.54%
Entertainment & media: how-to — 19.51%
Professional services: notes app — 16.67%, grid swap — 16.07%
Technology: letter — 17.57%, slideshow — 15.22%
Beauty & personal care: trend — 12.32%, letter — 12.27%
None of these leaders appear in the global top six. If you take “unboxing and offer-first banners win” from the headline and apply it to a B2B services account, you will most likely miss it.
One format does travel from one industry to another though — the letter. A plain, text-forward ad written like a note — lands in the top 10 by hit rate in 10 of the 15 industries, and takes an outsized share of budget in beauty (2.00x), finance (3.00x) and health & wellness (3.40x).
If you want one cheap format to test everywhere, that is the candidate the data supports.
Great study overall – but we have to highlight:
A winner is not a profitable ad. It is an ad the platform kept funding. Nobody here measured ROAS, margin or return rates.
The window is short and seasonal. Four months across the holiday peak.
The publisher sells creative analytics.
Some rates derive from tiny data samples. For example, a sale-announcement hook at 11.35% comes from 16 winning ads.
Industry tables have thinner data than the global one — treat a single striking number (street interviews at 30%) as a prompt to test, not a fact about your market.
Everything here is correlation. No one ran an experiment where the same offer was shot as five formats and rotated at random.
What the one non-vendor source adds
ViASNet is the only source here with no commercial stake — and that’s the reason why we want to add it here.
The researchers tracked the eyes of about 20 viewers each across 151 video ads and modelled where attention goes. One of their findings: scene cuts cause a spike in attention entropy — viewer focus scatters after each cut and has to be regained.
Why do we highlight this?
This finding gives a mechanism for what the Motion data shows from the outside: formats like text-only, letters and founder talking-head ads have very few cuts and one clear focal point. Nothing has to be re-hooked.
The playbook for winning creatives
Set a testing quota before you argue about creative.
Match the tier you are in: under $10K a month means roughly 3 new ads a week, $10–50K means 4–5, and above that scale up towards 7+. Volume is the variable with the clearest link to finding winners.Build a cheap-format core.
Text-only cards, product images with text, letter-style ads. They are the assets with the best hit rates and the fastest turnaround, which is probably the same fact twice.Keep one expensive format, not four.
High production had a below-average hit rate and took less budget than its share. It can earn its place, but it should be a deliberate bet.Lead with a concrete offer, newness or a price anchor in the first line, and treat relatability or authority hooks as brand support, not as your scaling engine.
Pull your industry’s table before you commit.
If your category’s top format is a street interview or a notes-app screenshot, that is a cheaper test than anything in the global list.Cut the clutter in video.
Fewer cuts, one focal point, the claim early. The eye-tracking evidence says every cut costs you attention you then have to win back.Judge on your own numbers.
Track your own hit rate (share of new ads that pass 10x your median spend) and your own cost per purchase. The benchmark is for direction; your account is the evidence.
Stacy’s Brain reads marketing research so you don’t have to, grades every source for methodology, sample and vendor interest, and tells you how far to trust each number.
See you in the next episode!