

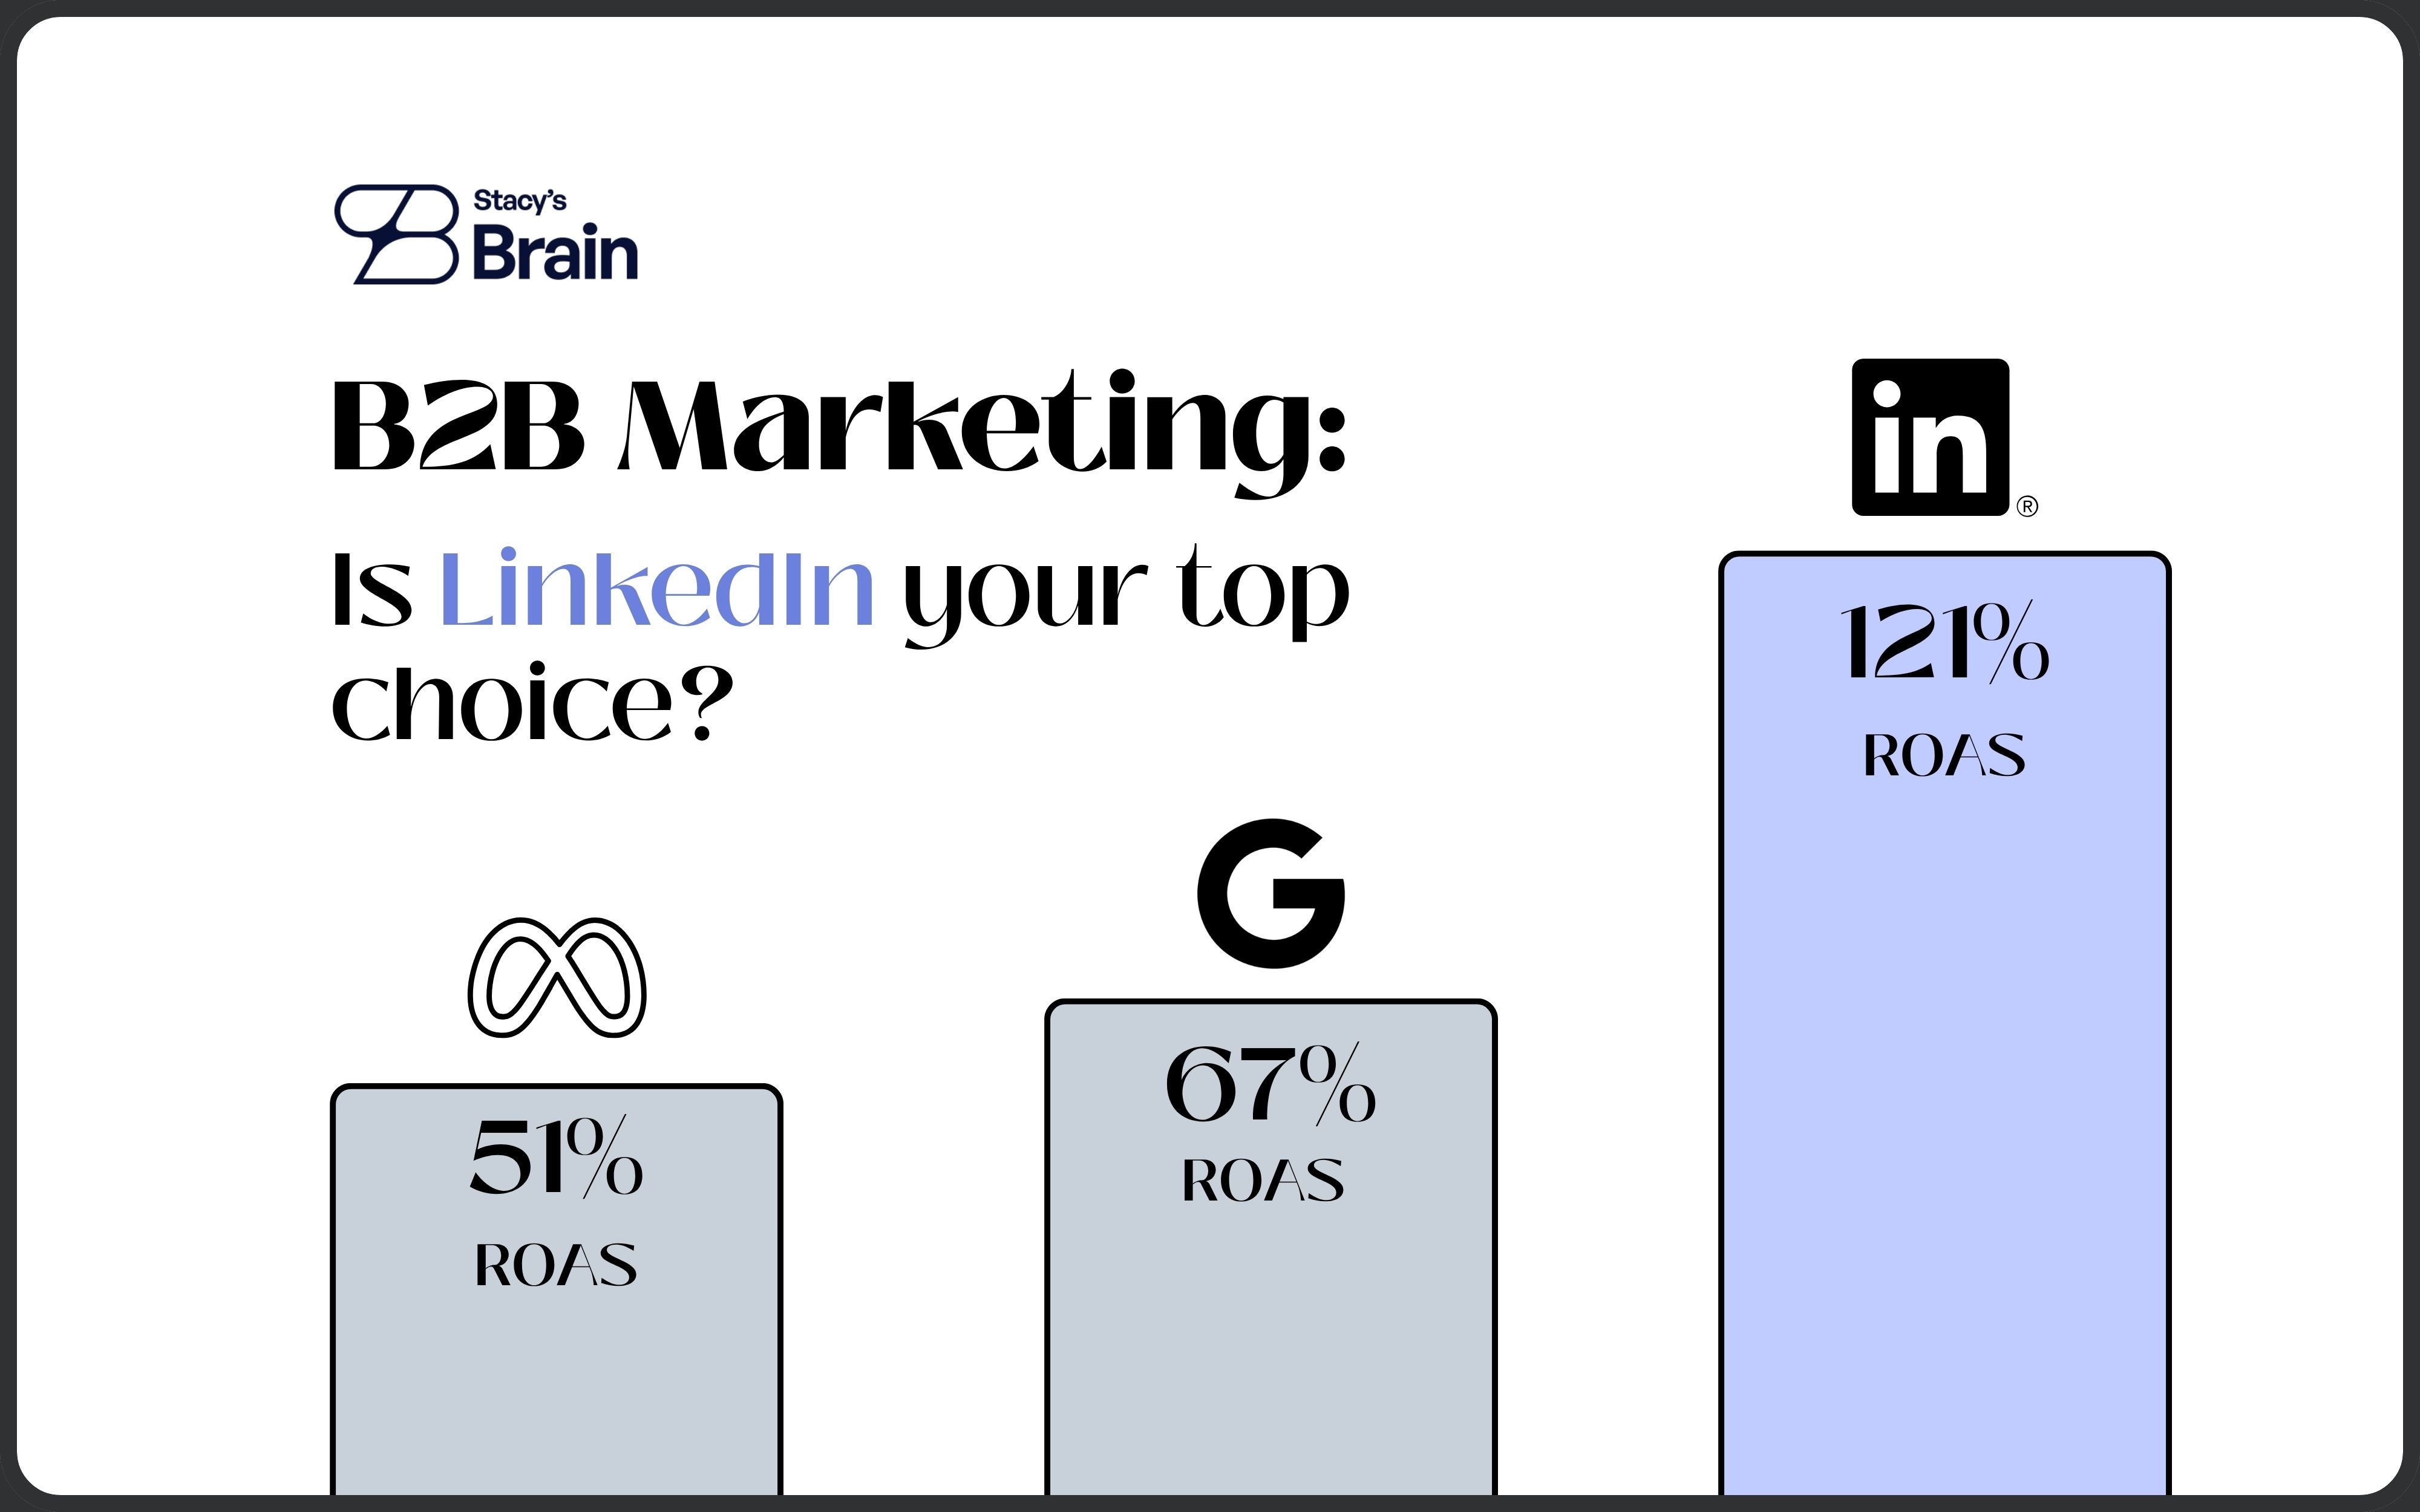
In 2026 LinkedIn Ads B2B Benchmarks Report, Dreamdata shares aggregated data from thousands of B2B customers, covering 66M+ sessions and 3.5M+ customer journeys. If you’re part of a B2B company and came across this report, you’ll walk away with just one conclusion: LinkedIn is where I should invest money.
But wait.
It’s just one dataset from one vendor.
We checked each claim in this report against other vendors focused on the same channels, as well as independent research, to understand how much we can trust this source, and whether we should act on it.
Spoiler alert: Some of the numbers hold up under the pressure of comparison. The headline ROAS figure does not.
Let’s look at the source first
Methodology disclosed: yes.
Sample disclosed: yes.
Vendor interest: high.
Dreamdata sells B2B attribution and activation software, and in fact every finding here argues for more attribution and more LinkedIn.
Two structural limits on the sample we need to know about:
Only customers who agreed to benchmark use are included. These are companies that already bought an attribution platform, which means already spending on LinkedIn.
Dreamdata’s new IP-to-company engine, which identifies up to 15 times more companies than before, and LinkedIn’s Company Intelligence API were released within the comparison window — so the factors aren’t isolated.
Claim 1: LinkedIn has the highest ROAS
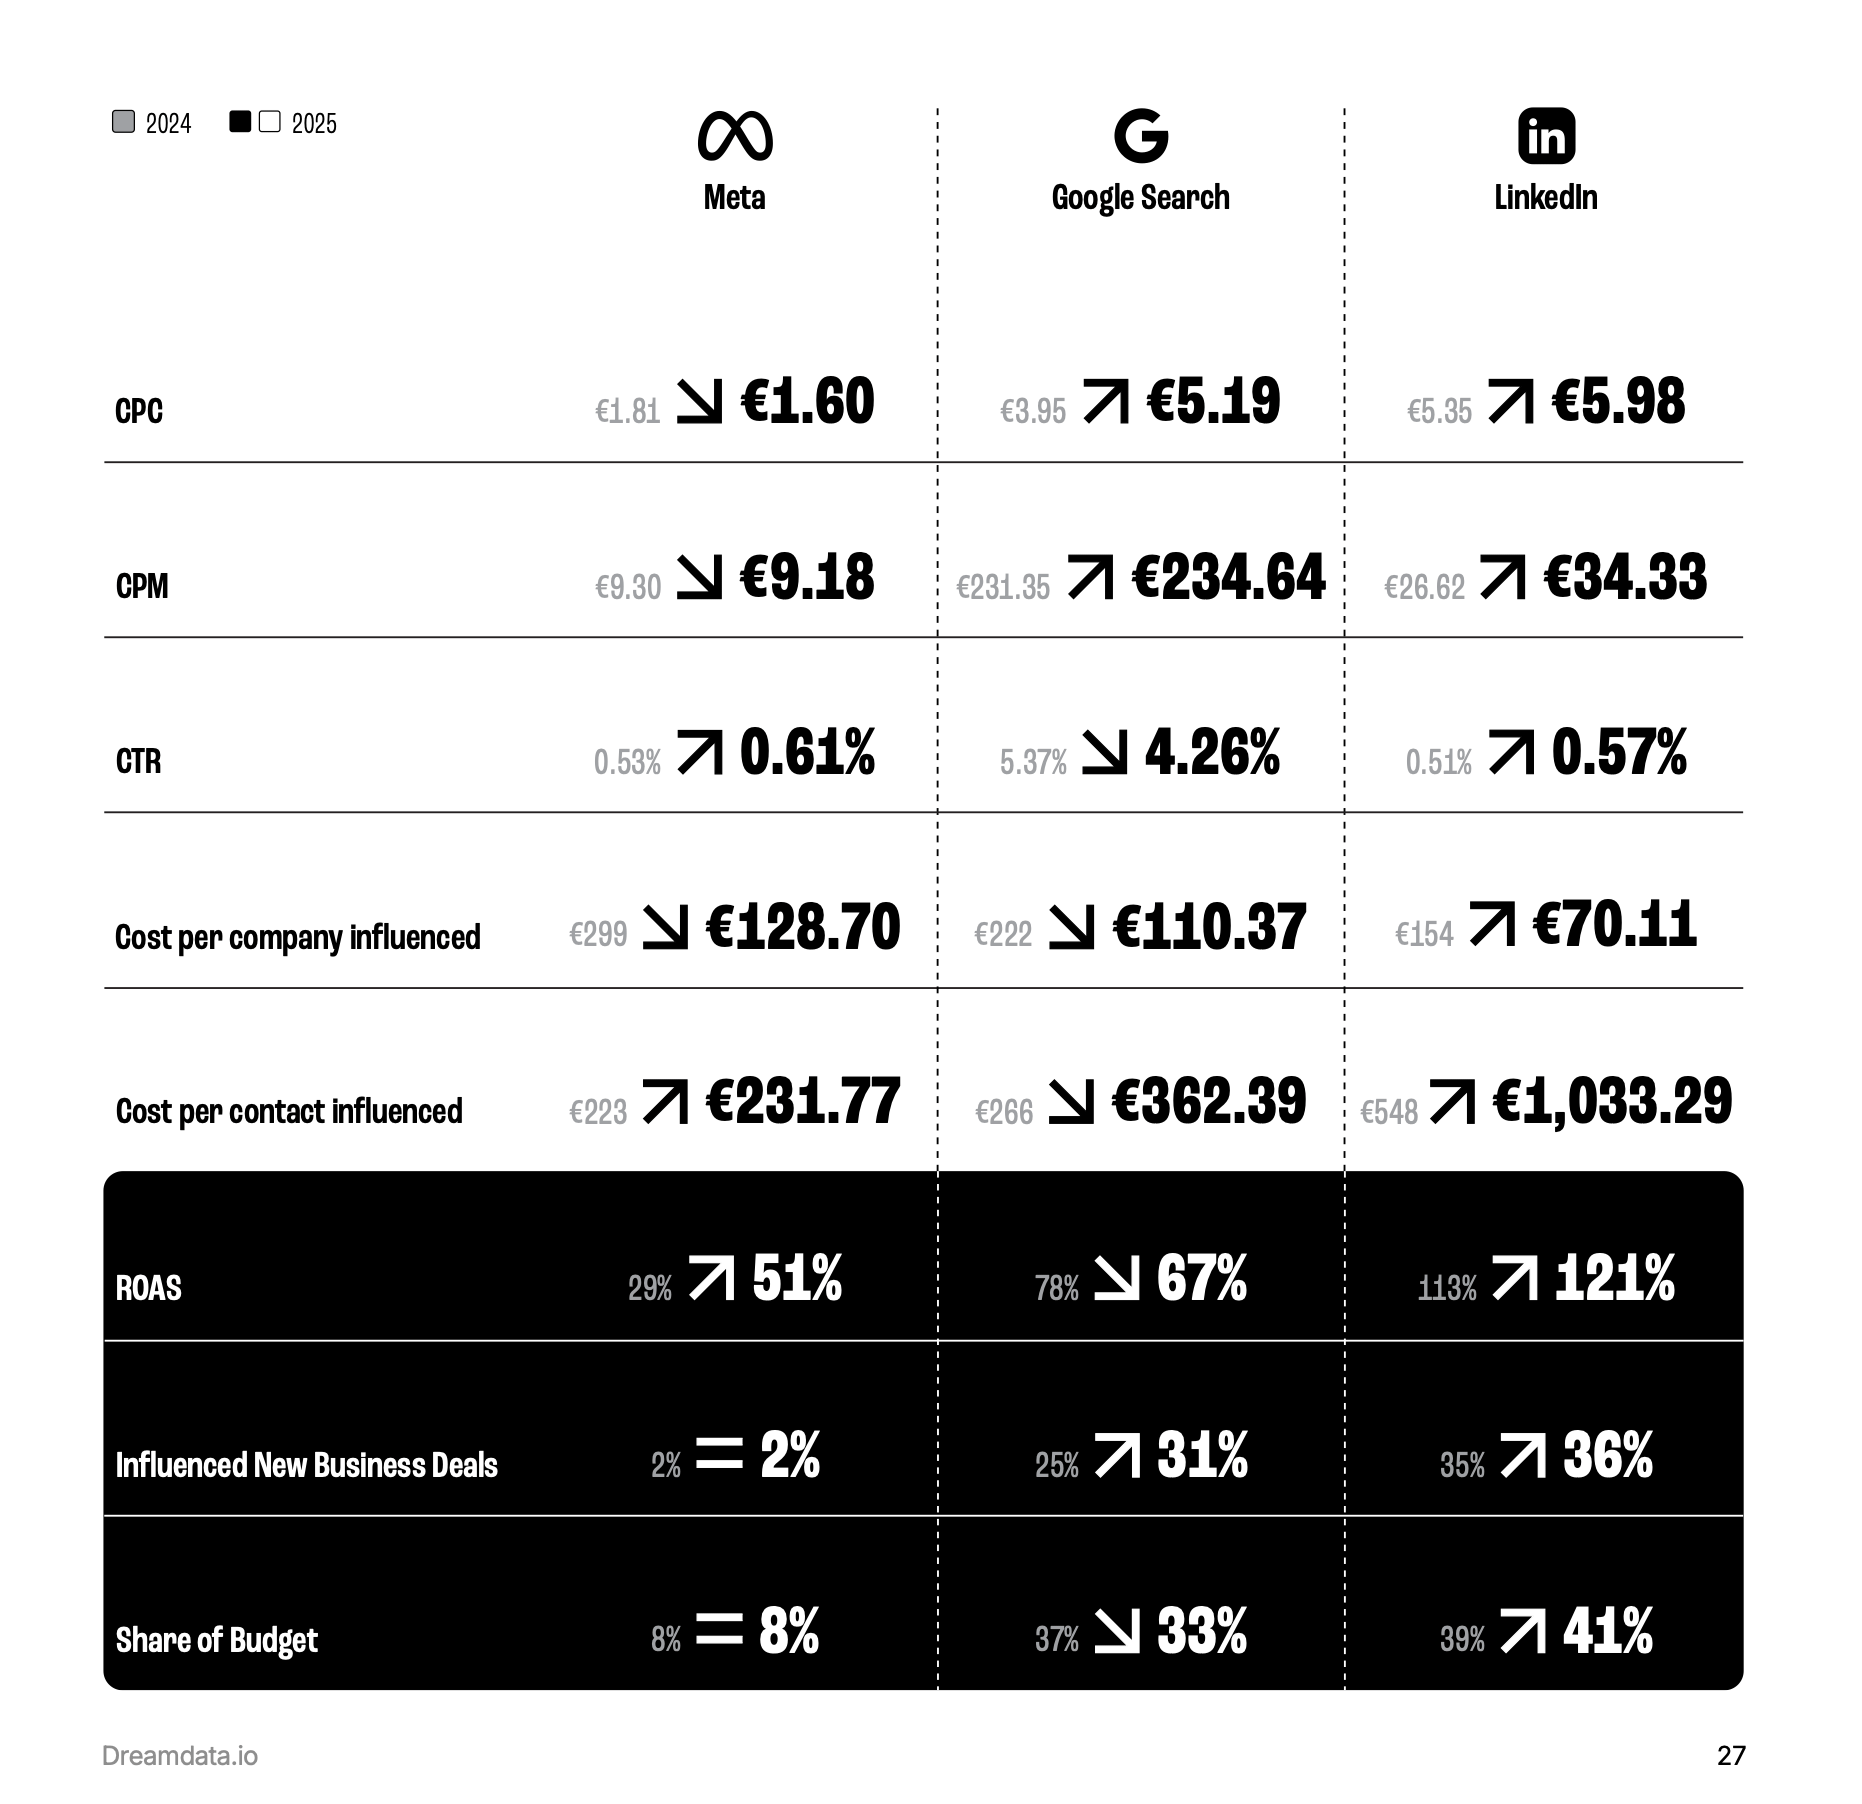
The reported figures for 2025:
LinkedIn 121%
Google Search 67%
Meta 51%
Here’s what that means: Two of the three channels return less money than they cost.
Plus (!) the winner clears its own media cost only by 21% BEFORE we deduct cost of goods, sales salaries, or the software the deal runs on. At a typical B2B SaaS gross margin, 121% ROAS = loss.
Though, B2B revenue is usually multi-year while the research looks into 12 months only, and we have to count this in as well (not just for LinkedIn; for Google and Meta as well).
What does not survive is treating these findings as a universal benchmark.
There is a canonic study from 2015: Blake, Nosko and Tadelis (2015) in Econometrica, who switched eBay’s paid search off across randomly selected US regions for 60 days.
Results:
On branded keywords, 99.5% of the click traffic lost to disabled ads came straight back through organic search.
On non-branded keywords the experimental return was −63%.
What does this give us?
Their own conclusion: “typical regressions of sales on advertising spend result in astronomical ROI estimates that vastly overestimate the true ROI, which can only be estimated using controlled experiments.”
In other words, if no one has checked what happens when you turn off a certain ad source, we can’t really judge its ROI.
Claim 2: LinkedIn is the cheapest way to reach a company
Next benchmarks from the report:
Cost per company influenced, 2025: LinkedIn €70.11, Google Search €110.37, Meta €128.70.
Cost per contact influenced, same table: LinkedIn €1,033.29, Meta €231.77, Google Search €362.39.
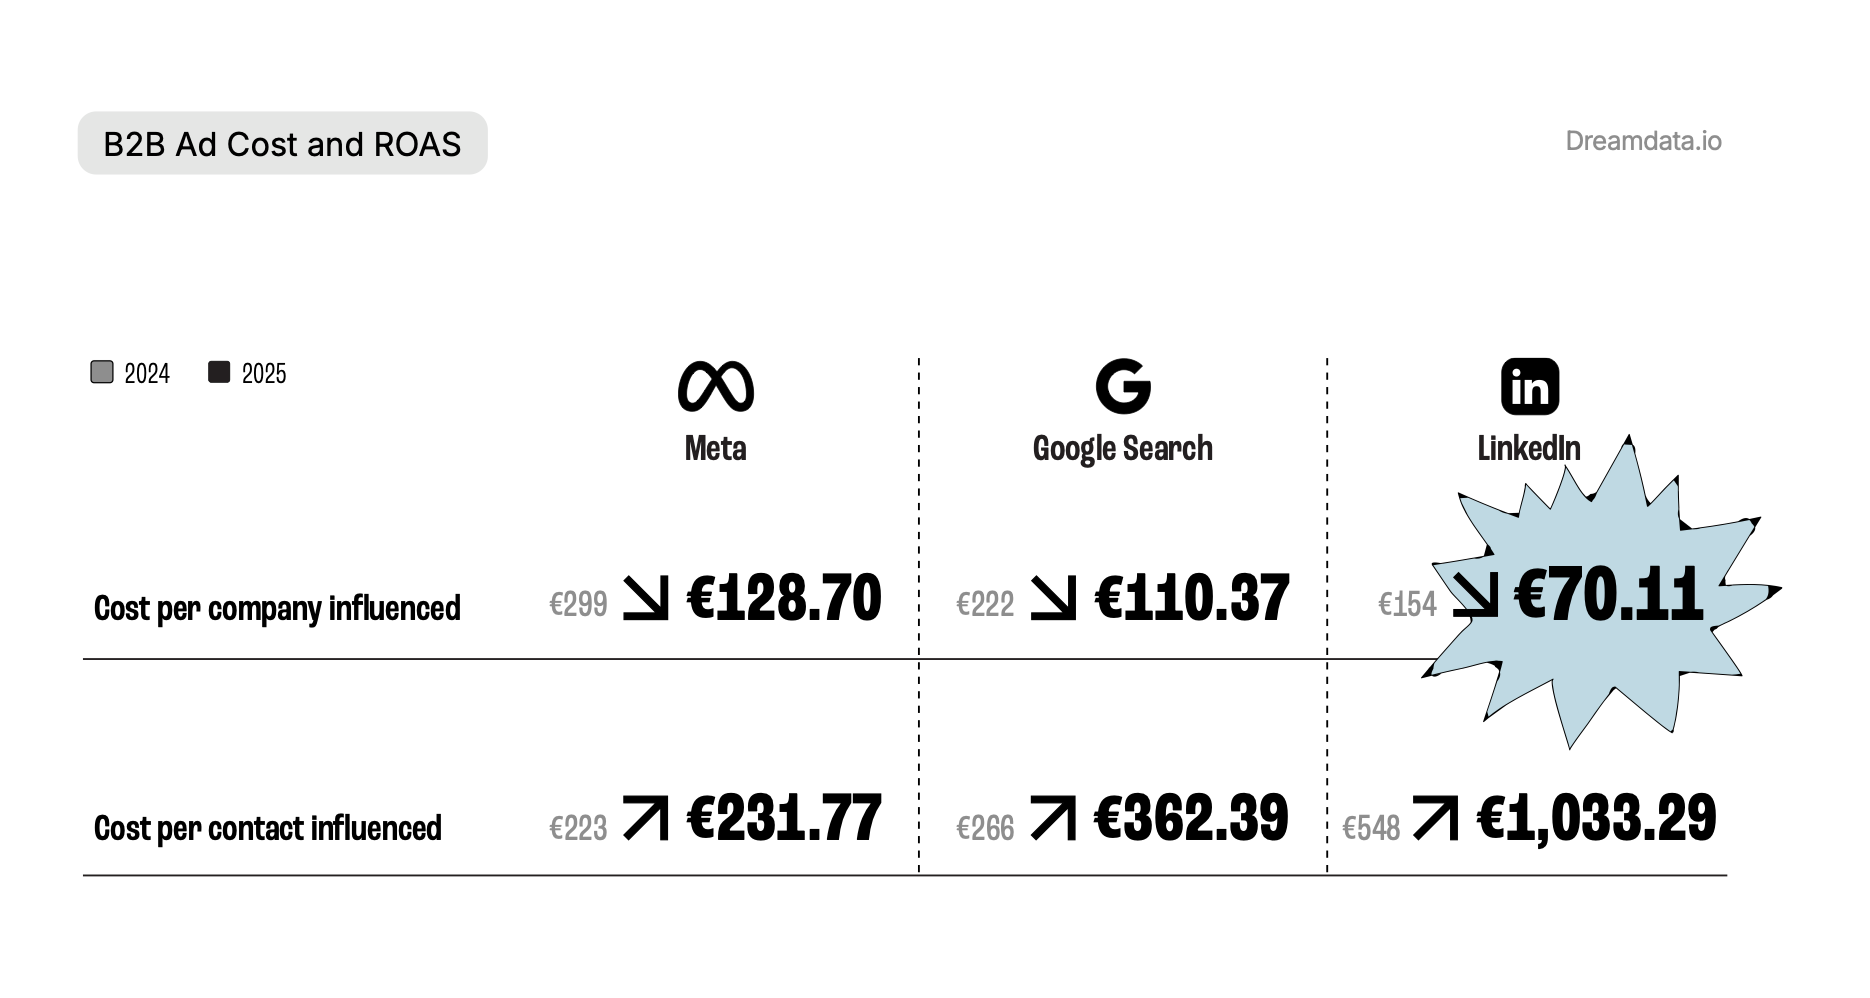
LinkedIn is the cheapest per company and the most expensive per person by a wide margin: 2.9x Google Search and 4.5x Meta.
Which one it more important? Depends on how many people have to be reached inside an account.
Gartner surveyed 632 B2B buyers in August–September 2024 and found buying groups “ranging from 5 to 16 people across as many as four functions”.
Need to reach 5 people = LinkedIn is fine.
Need to reach 16 people = it might be too expensive.
A channel that reaches one person per account cheaply, and the other four to fifteen expensively, is a different proposition than “cheapest per company” suggests.
Claim 3: LinkedIn takes the largest share of B2B ad budget
Share of total ad budget among Dreamdata customers, 2025: LinkedIn 41%, Google Search non-brand 33%, Facebook 8%, Google Search brand 8%, Google Smart 3%, Bing non-brand 3%, and 1% each for Google Display, YouTube, Google Other and Capterra.
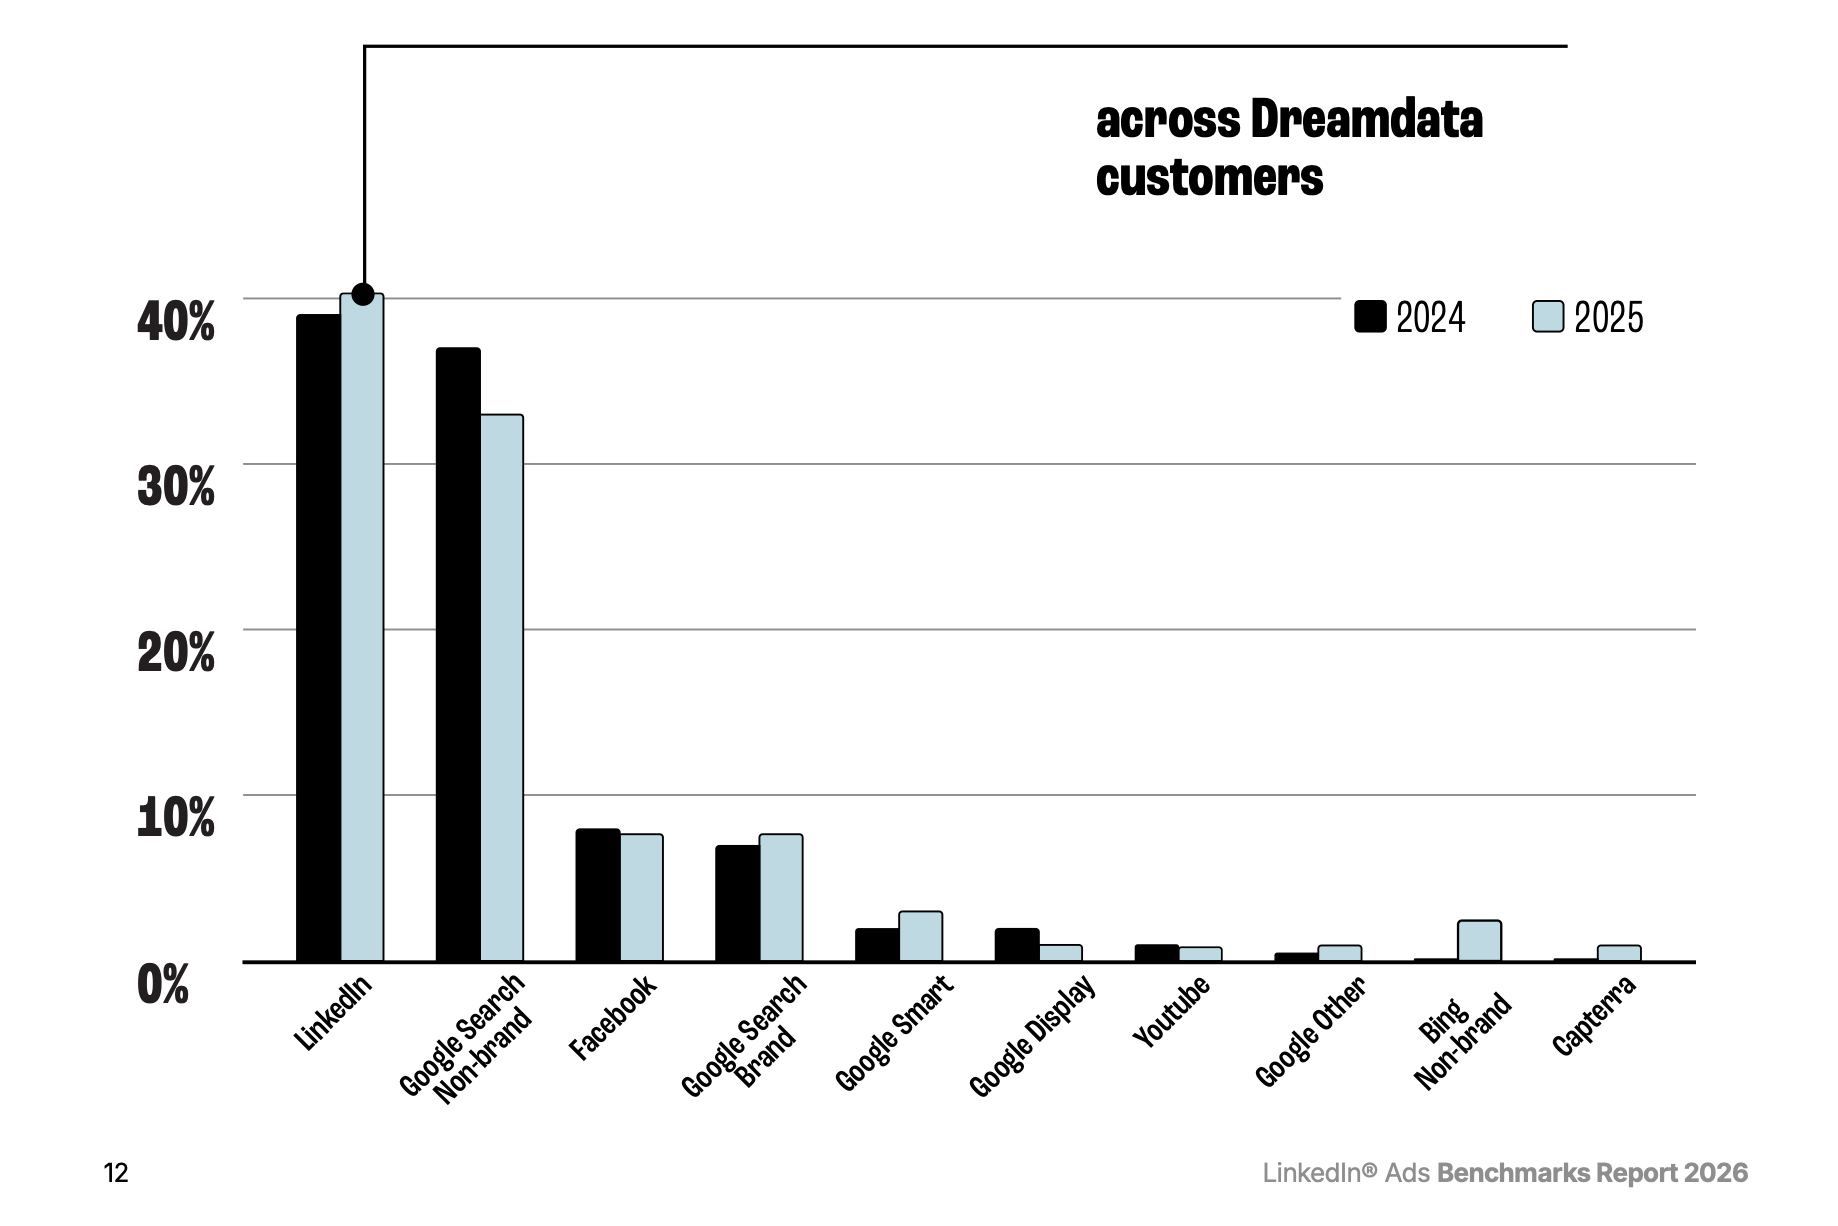
This one is certainly accurate for the sample: the population is companies that bought B2B attribution software. Grouped together, Google’s properties (search brand and non-brand, Smart, Display, YouTube, other) take 47% against LinkedIn’s 41%, by the way.
Now let’s compare Dreamdata vs. a second vendor, measuring the same channel
HockeyStack Labs’ LinkedIn Ads benchmark report covers 70+ B2B SaaS companies between $5M and $1B ARR, with $28M of ad spend over three years, and a position-based attribution model (40% first touch, 40% last touch, 20% distributed).
Where the two disagree:
CPC.
Dreamdata: €5.98.
HockeyStack: $10.48 in Q1 rising to $15.72 in Q3.
Currency accounts for part of the gap and not most of it.CTR.
Dreamdata: 0.57%.
HockeyStack: 0.82% to 0.96% by quarter.Return. Dreamdata: 121% ROAS.
HockeyStack: pipeline ROI of 2.44x to 6.01x, revenue ROI of 2.46x in Q4.
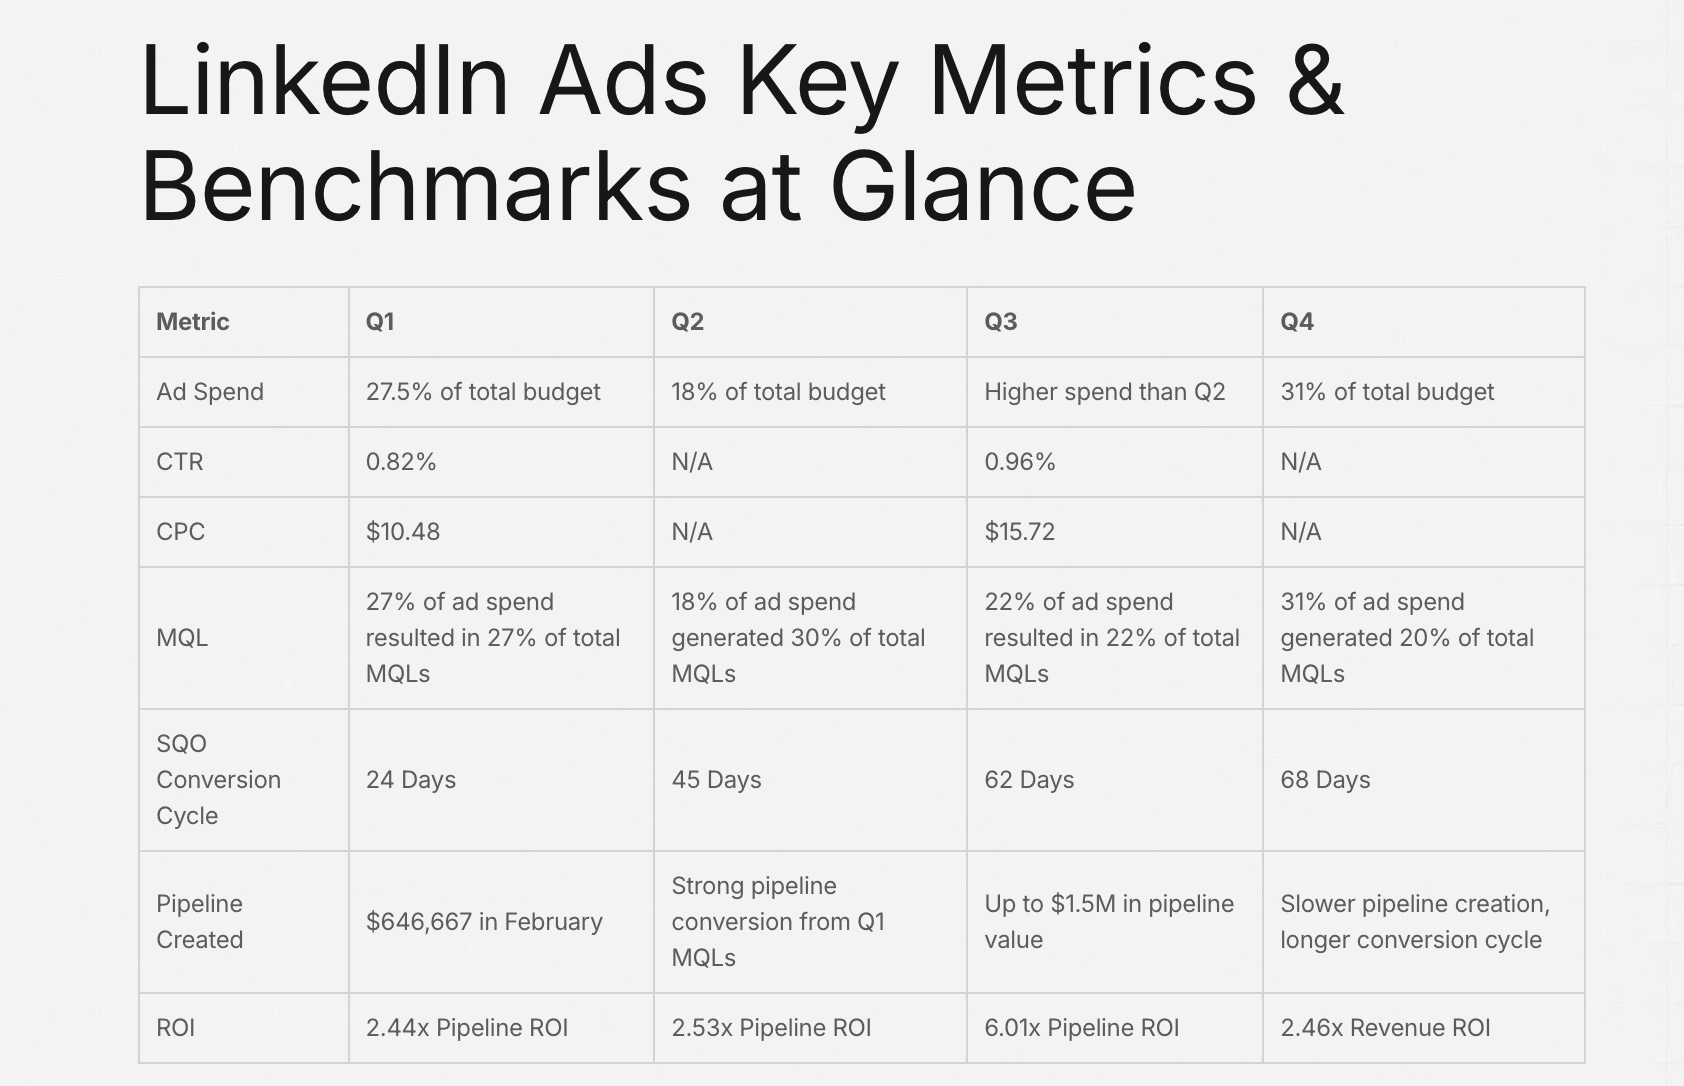
Same platform, overlapping years, two datasets built from real spend, and a headline ROI that differs by roughly double.
And no — neither vendor is lying. They have different customers, different attribution windows, different models, and different definitions of what counts as revenue. The important thing: a single vendor’s benchmark tells you what LinkedIn did for that vendor’s customers under that vendor’s model.
The 272-day journey
Dreamdata reports an average B2B customer journey of 272 days, split 81% marketing (first touch to sales pipeline) and 19% sales (pipeline to closed deal).
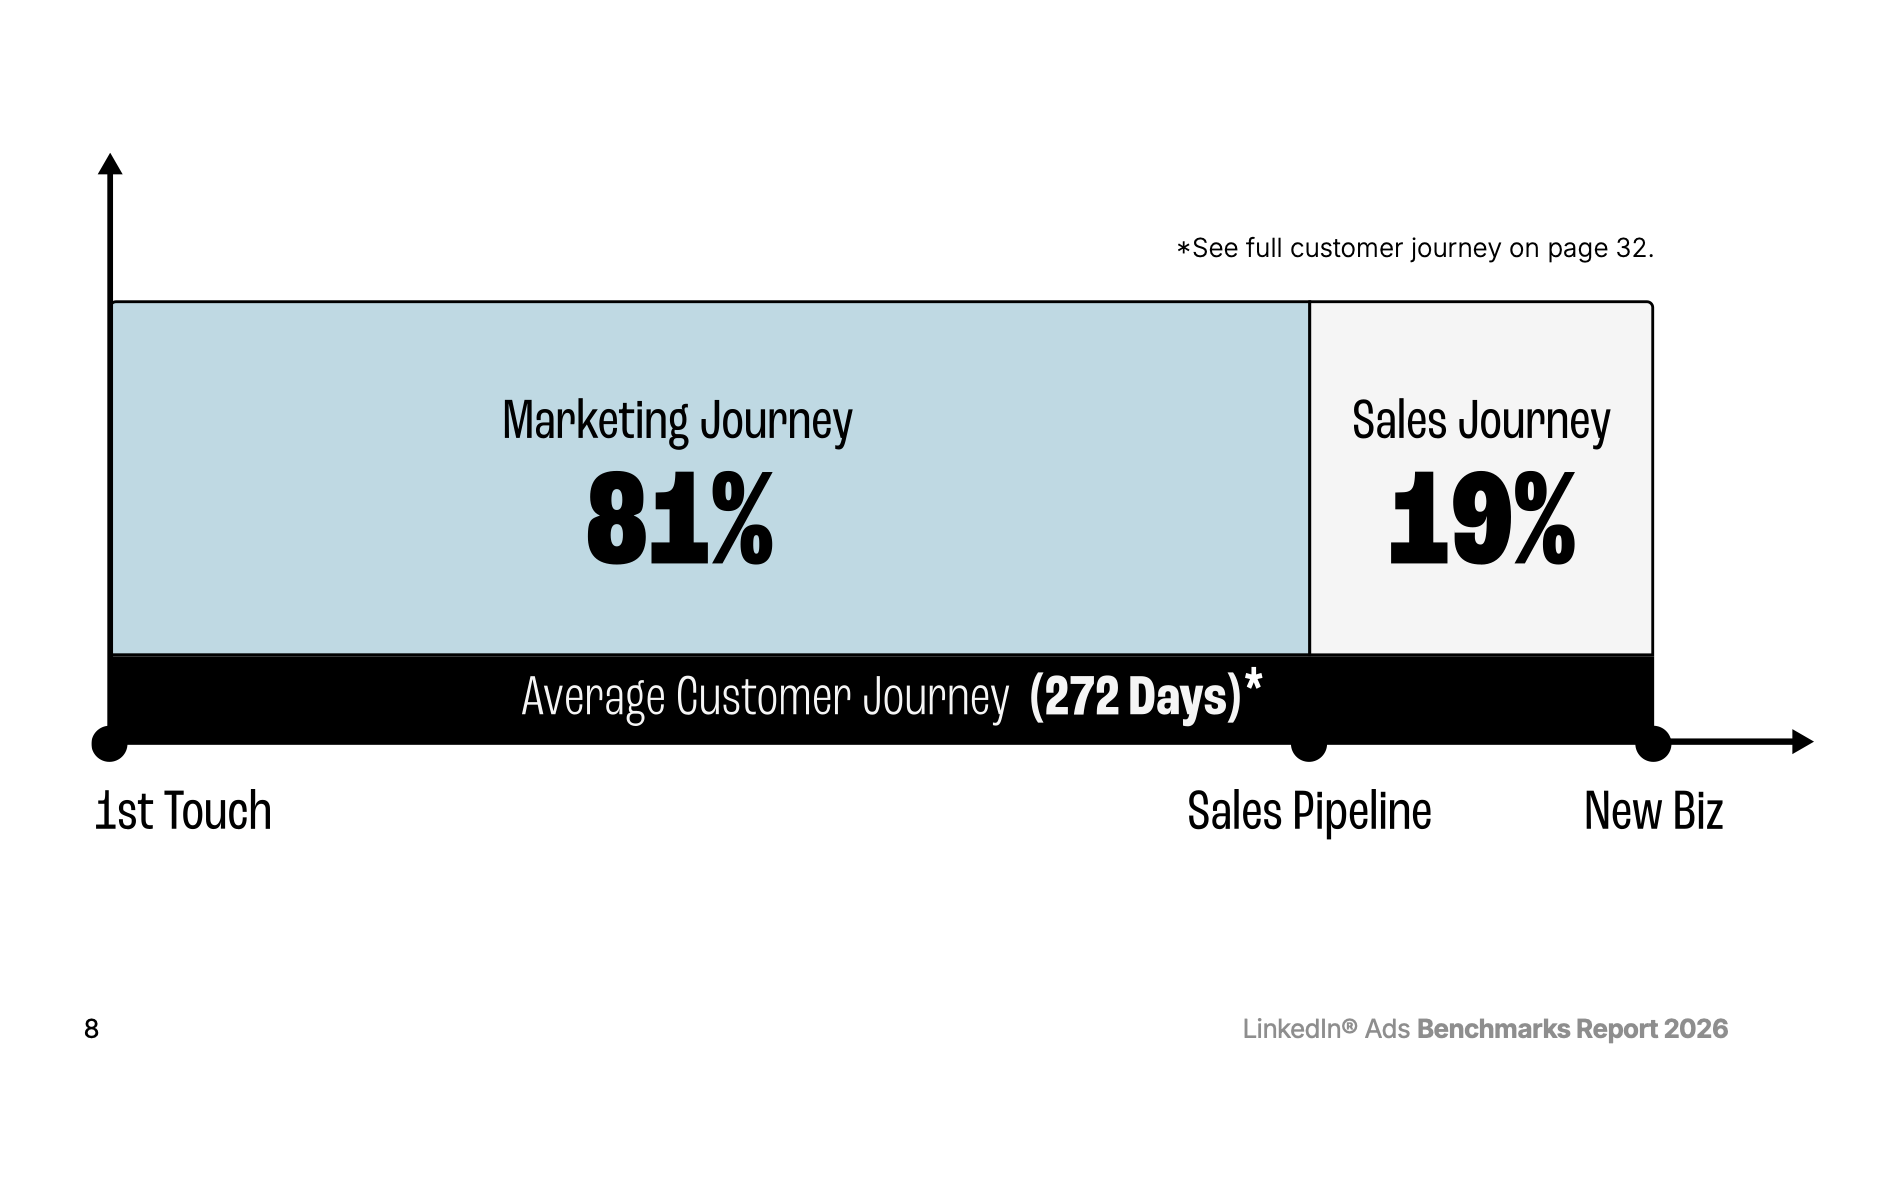
We don’t have an independent source in our database to check this against — so you can treat the 272 days and the 81/19 split as indicative figures.
Margin note worth noting alongside:
The Ehrenberg-Bass estimate, produced by John Dawes for the LinkedIn B2B Institute, claims that up to 95% of businesses are not in the market for most goods and services at any one time. That means that most people you target are not really into buying anything you’re trying to sell them. It is a derived figure though, calculated from ~5y supplier switching cycles rather than measured directly.
What else is worth highlighting?
Paid search is getting more expensive and less clicked in B2B
Google Search non-brand CPC rose from $4.13 in August 2024 to $5.34 in July 2025, up 29.36%, while CTR fell from 5.47% to 4.04%, down 26.16%. In the report, this is a within-account trend on the same measurement basis, which makes it more reliable than any cross-channel comparison in the report.
CPM benchmarks
CPM of €34.33 on LinkedIn against €9.18 on Meta confirms what every B2B advertiser already pays. Google Search at €234.64 is not comparable and should not sit in the same column — search impressions are scarce and intent-loaded by design.
LinkedIn might be even less efficient than Meta
LinkedIn’s CTR of 0.57% sits below Meta’s 0.61% while costing 3.7x more per thousand impressions. The report publishes this without spinning it.
The practical part:
If you are buying LinkedIn ads on Monday
We’d use the report for CPM and CPC expectations, and for the direction of Google Search costs. Both are measured consistently within one system.
Do not use the 121% ROAS to justify a budget.
Run a holdout instead: pick a matched set of target accounts, stop LinkedIn spend against them for a full quarter, and compare pipeline creation. A 272-day journey means you will wait, and the wait is the price of an answer that attribution cannot give you.Track cost per contact influenced alongside cost per company influenced. With buying groups of five to sixteen people, the €70 figure and the €1,033 figure describe two very different campaigns.
See you in the next episode!
Stacy’s Brain reads marketing research so you don’t have to, grades every source for methodology, sample and vendor interest, and tells you how far to trust each number.
Sources
2026 LinkedIn Ads B2B Benchmarks Report — Dreamdata — vendor report, high vendor interest, methodology and sample disclosed
LinkedIn Ads Benchmark Report — HockeyStack Labs — vendor report, high vendor interest, sample and attribution model disclosed
Blake, Nosko & Tadelis (2015), Econometrica — randomized field experiment, no vendor interest
Gartner B2B buyer survey, May 2025 — 632 buyers, fieldwork Aug–Sep 2024
Ehrenberg-Bass / John Dawes for the LinkedIn B2B Institute — derived estimate, commissioned by LinkedIn