

A few days ago I wrote in my Telegram channel that content is a system, and that the closest thing to growing a personal brand is being a solo founder. You ship, you measure, you change something, you ship again.
Many of my readers asked how I actually measure. So here is the whole thing:
What the system does
What it runs on
How long it took to set up
How much time it eats every week
Which decisions it has already changed for me
Why I needed it
I publish in four places:
The Stacy’s Brain newsletter on Substack (the one you’re reading now)
Substack Notes
My X profile
The GTM in public Telegram channel.
That is 30+ posts a week.
Every platform has its own dashboard, its own definition of a “view”, and its own blind spots.
For example, Substack doesn’t show unsubscribes on free publications. Telegram hides which posts people forward, and you can see shares only in account statistics. Plus, traffic from Telegram almost always shows up as “direct” in Google Analytics. X counts clicks per tweet, so a link in a thread disappears from the stats.
Before the system, I was confident my Telegram channel was bringing in newsletter readers, while X was a secondary channel. After a month of tracking, I can now say my initial thesis was wrong.
However, I’m rushing with the lessons — let’s start with the “why.” Here are the goals I set for the system — quite simple:
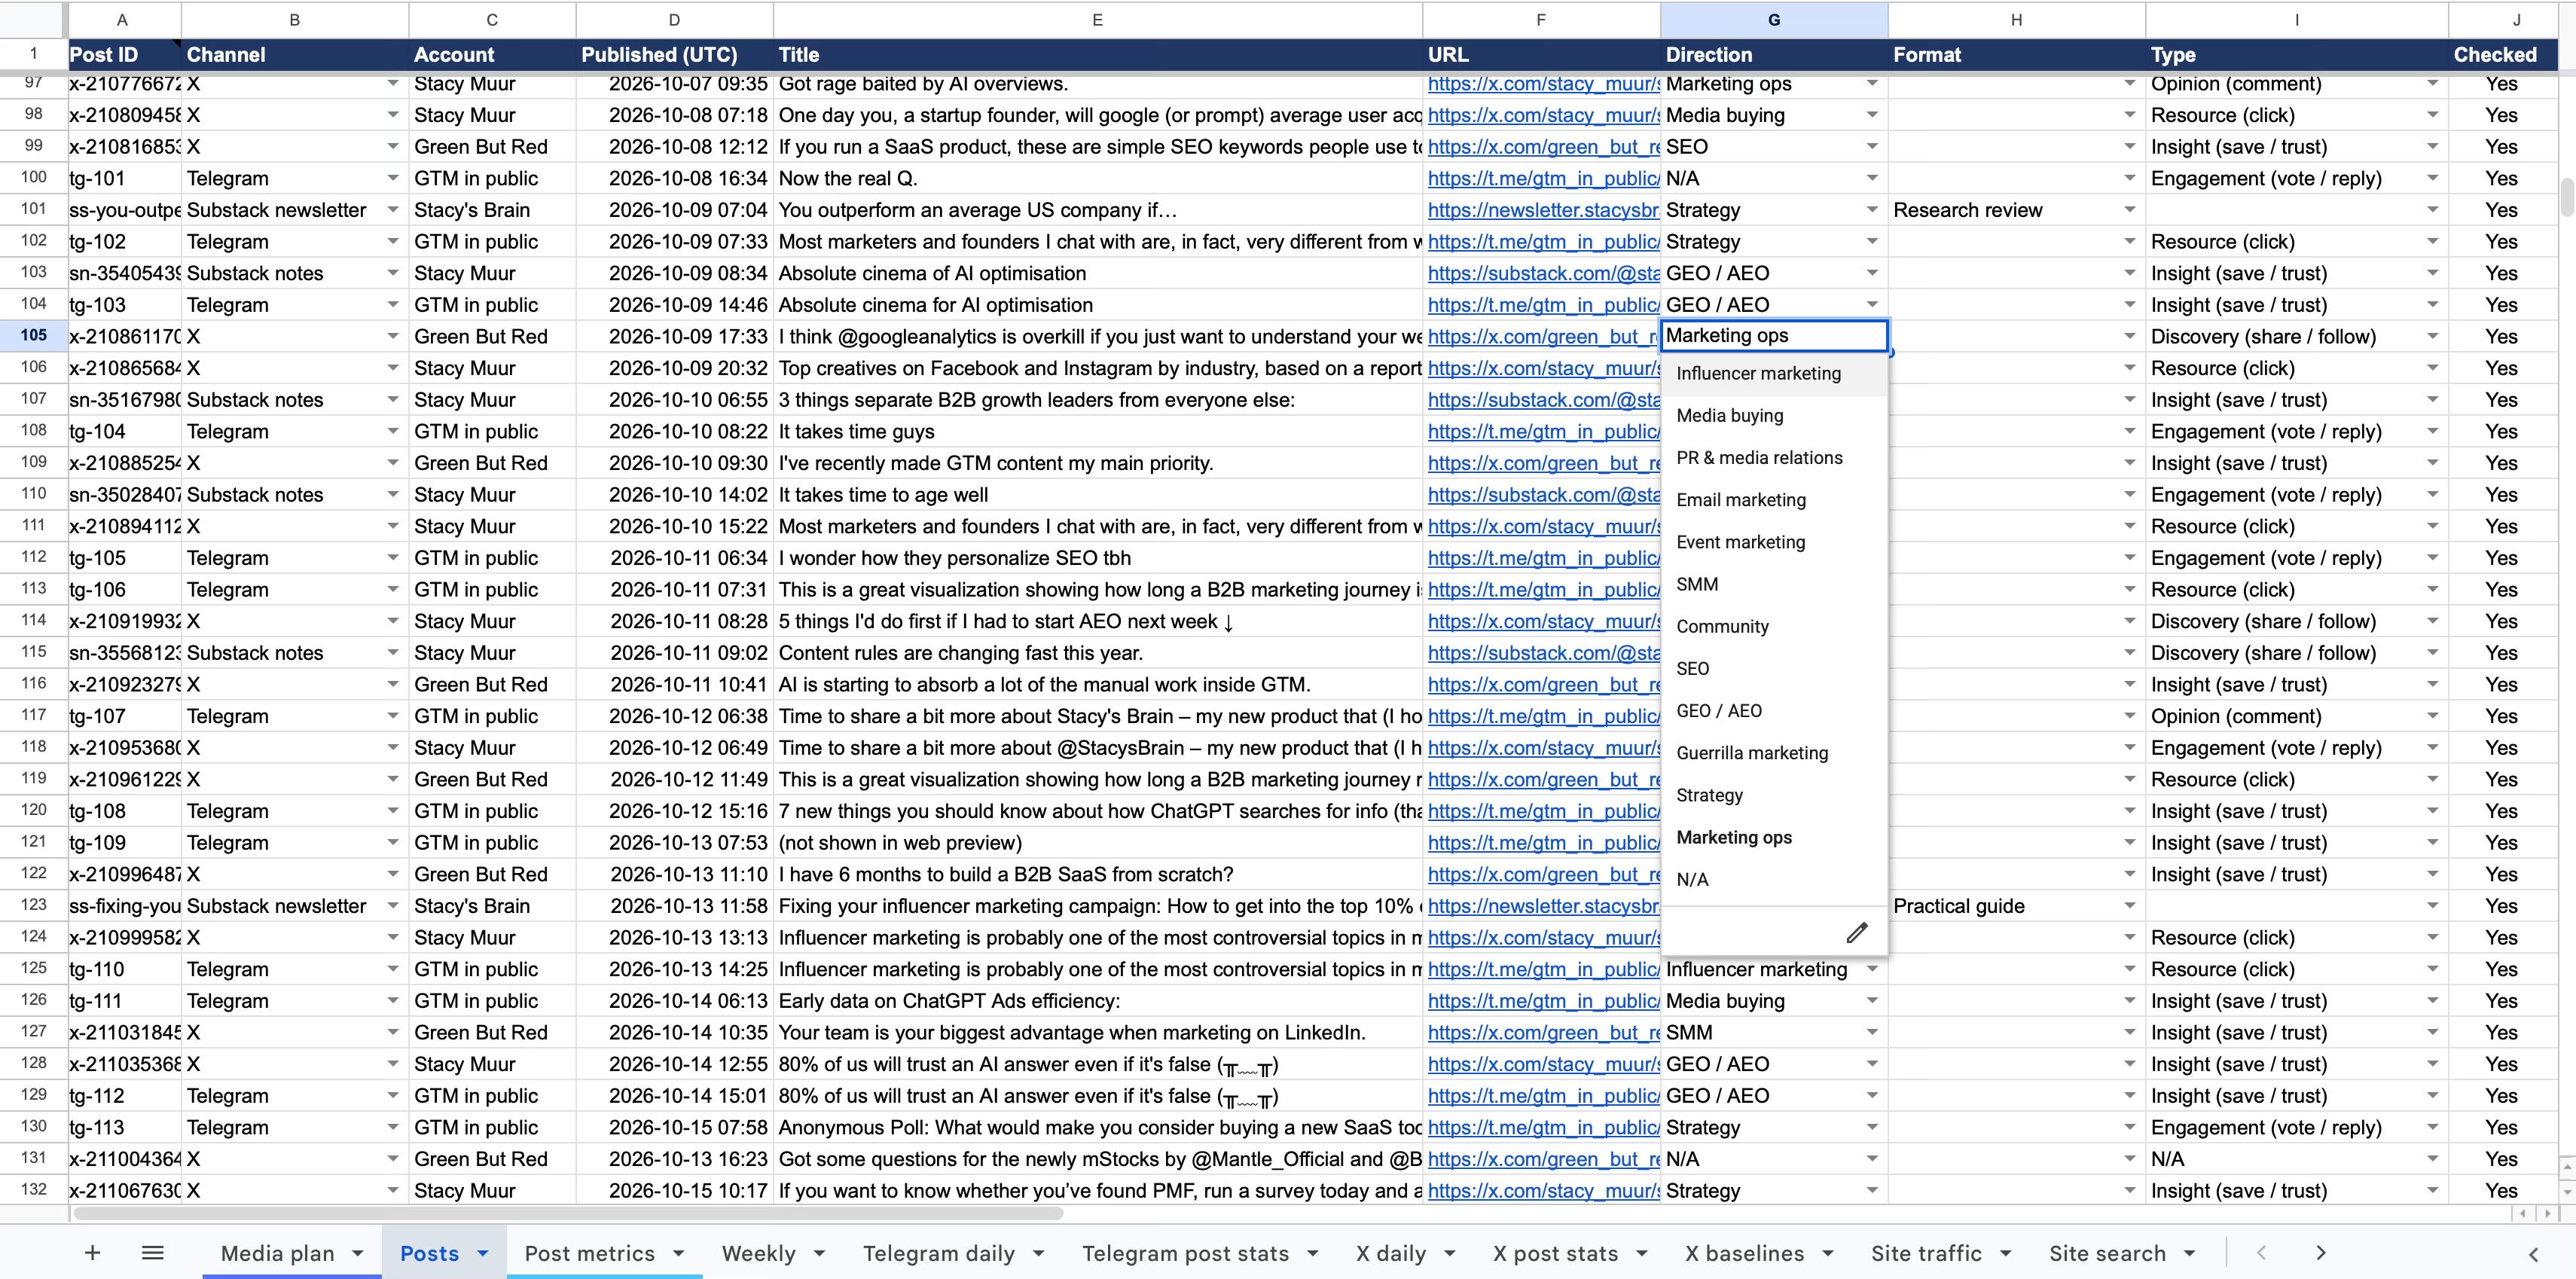
One registry of everything I publish, across all platforms, with the same labels: topic, format, and the action a post is built for (share, save, comment or click).
Snapshots at fixed ages (7d and 30d), so a post from Monday and a post from Friday are compared fairly.
One weekly view of growth: subscribers, followers, views, shares, and where new readers came from.
A short list of things to do this week, instead of a dashboard I’d have to interpret.
What it runs on: Pieces of the puzzle
Google Sheets
The database: one spreadsheet for content, plus separate spreadsheets for paid placements, zero-cost marketing experiments, and SEO. If you love Notion/Airtable, you can build it there — but for v1, I went with the easiest and cheapest option.Typefully
Where X posts are drafted and published. Its API provides a list of published posts, including full text and tags. Since I already pay for Typefully, it’s cheaper for me than connecting to the X API directly. The only downside is that I need to export analytics manually once a week.
If you don’t have Typefully, connecting to X directly is the best option and will cost about $2–$3 per month.GA4 (+ Search Console)
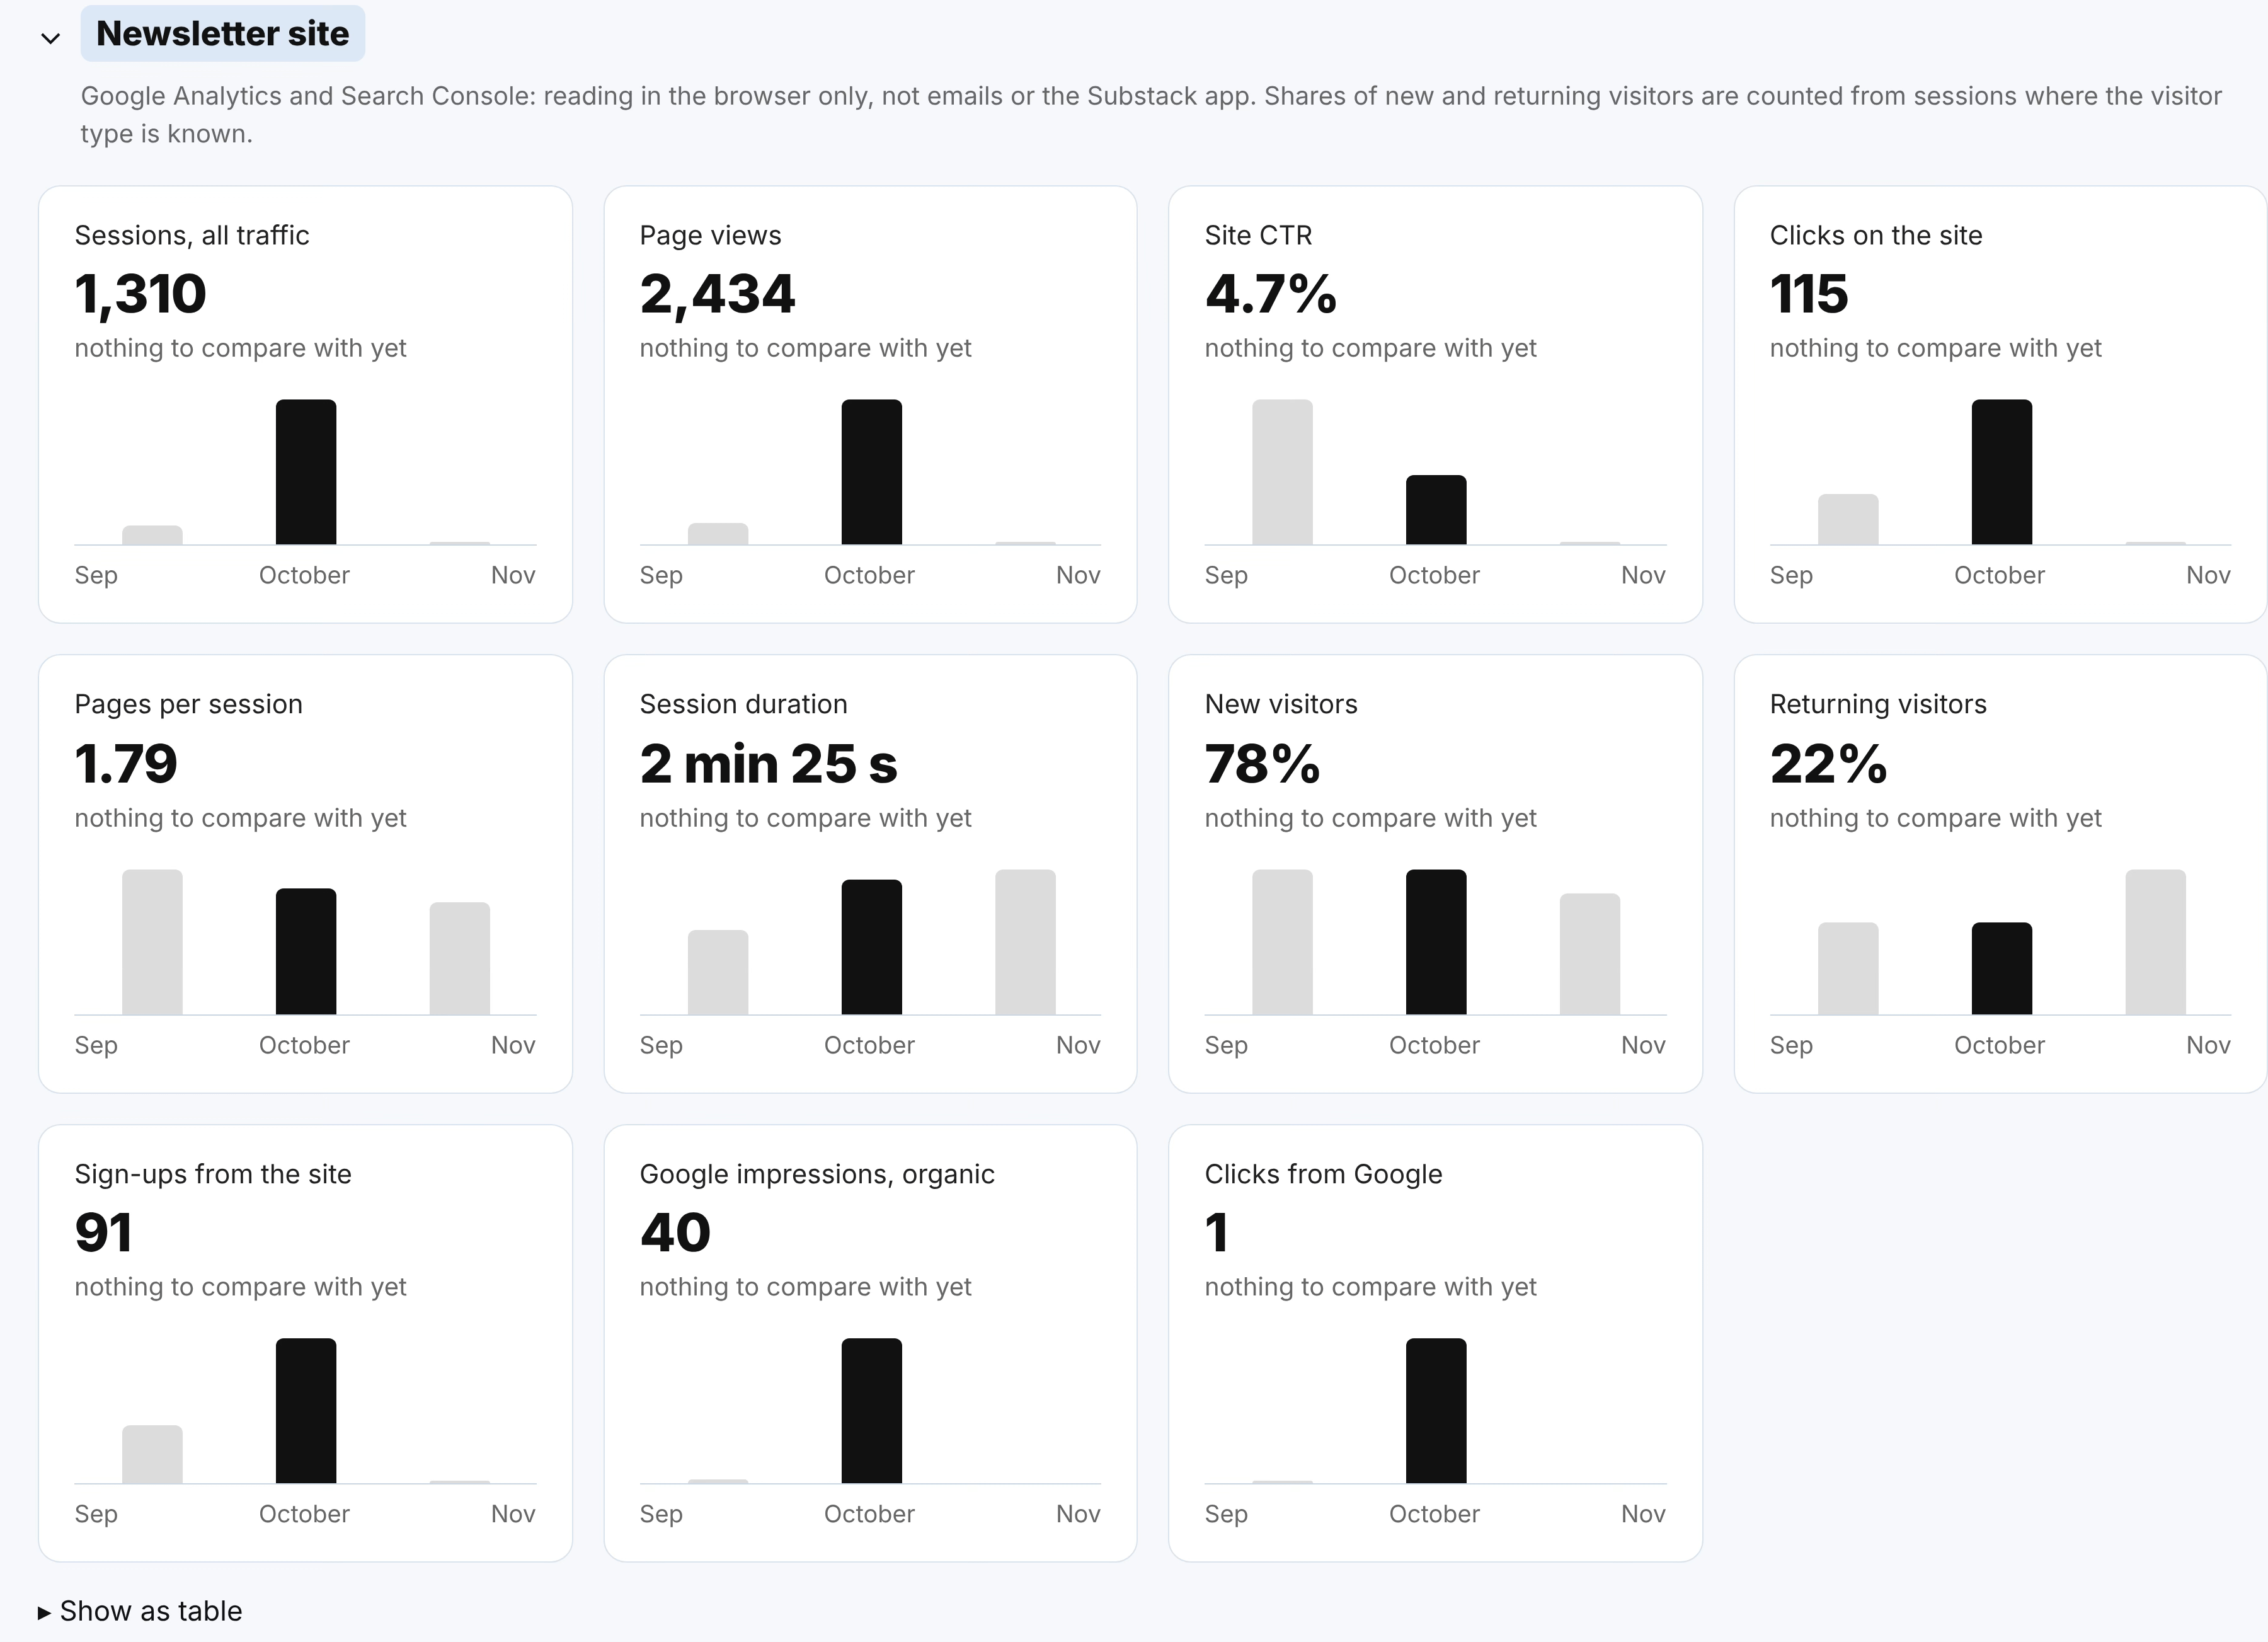
Traffic and sign-ups on the newsletter site, by page and source.n8n
The glue. A workflow runs twice a week, collects new posts from every platform, labels them and writes snapshots into Sheets.Claude
Built most of the above with me; labels posts, loads the weekly exports, writes the weekly analysis, and builds the dashboard (I also have it as an artefact for visualisation).Native exports
Substack (subscribers, traffic sources, growth sources), Telegram channel statistics, X analytics CSVs.
Margin note: I share many such automation experiments on Telegram – so if that’s your field of interest make sure to join!
How the pieces connect
Registry
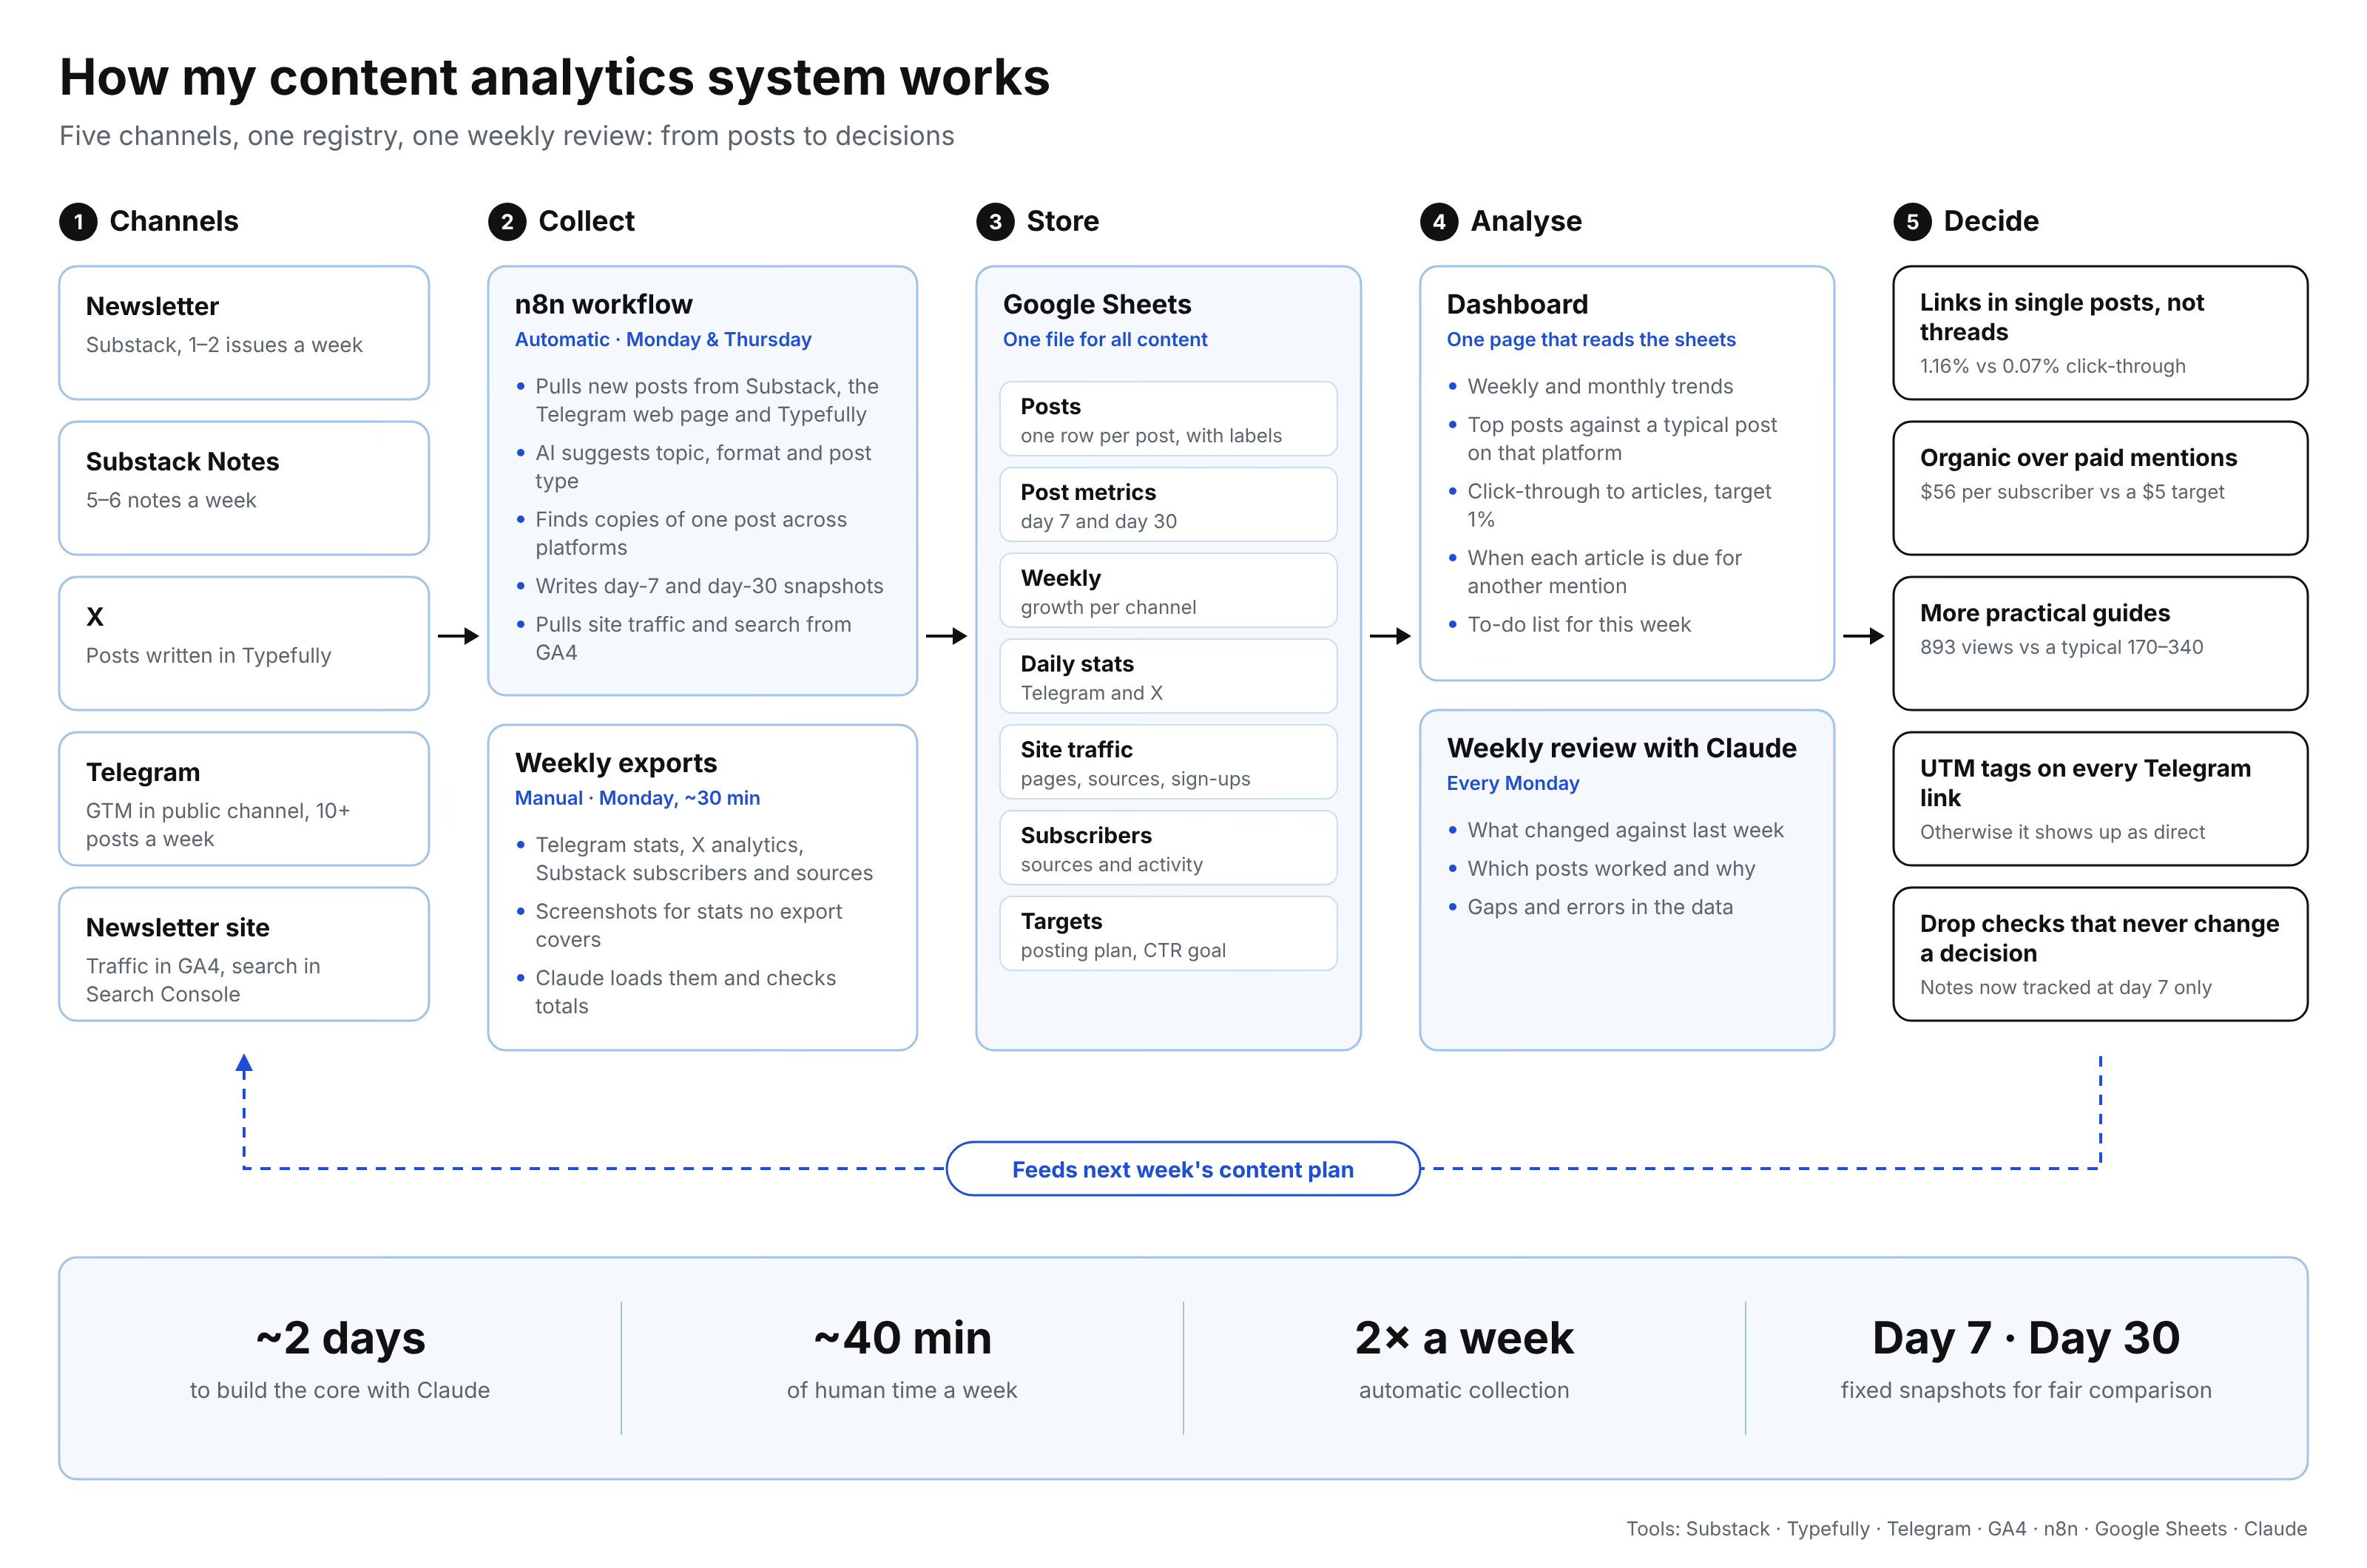
Twice a week (Monday and Thursday morning) the n8n workflow pulls new posts: the Substack archive and notes, the public web page of the Telegram channel, and published drafts from Typefully. Every new post gets a row.Labels
A model suggests a topic (one of 12 marketing directions, e.g., SEO / SMM / Strategy), a format for newsletter issues, and a post type based on the desired target action — e.g., discovery (main goal: maximise shares) or resource (main goal: link clicks). I review the labels once a week and correct them. Edited copies of the same post on other platforms are detected automatically and inherit the original labels.Snapshots
At 7 days and 30 days the workflow writes a metrics row for each post. Public numbers (likes, restacks, views, reactions) come in automatically. Private ones are added by hand from screenshots.Weekly exports
On Monday I drop the Telegram, X and Substack exports into a Claude chat. Claude loads them into the right tabs, checks the totals against the files, and writes a short summary of the week.Dashboard
A single page reads the sheets and shows trends, top posts relative to a typical post on that platform, article promotion windows and a “this week” to-do list.
Now, here’s how long setup took
The core (registry, snapshots, Telegram and X, auto-labelling, the first dashboard): about two intense days with Claude.
Everything around it (GA4 and Search Console, subscriber exports, paid placements, outreach tracking, anomaly rules): another week of short sessions, 30–60 minutes each, as questions came up.
What took the time was deciding the rules: labelling logics, platform-specific limitations (i.e. how to compare a thread with a single tweet). Every one of those is a decision only you can make about your own content, so the decisions will be unique to your system.
My weekly analytics routine
Monday, ~30–40 minutes: download the exports (Telegram, two X profiles, Substack subscribers and sources) and take screenshots of the post stats that no export covers, then send everything to Claude.
Once a week, ~15 minutes: go through the new posts and confirm the labels.
Everything else is automatic: collection, snapshots, weekly rows, formulas.
Once a month ~1h: actual analysis of what worked, what needs to be changed, and a map of SMM hypotheses for the next month
The manual part shrinks over time.
Last week I compared notes at 7 and at 30 days: reach grows 15–40% after the first week, but the ranking of notes never changes. So I dropped the 30-day snapshot for notes and saved myself a batch of screenshots every week.
What I track
Per post
Reach and engagement at day 7 and day 30, compared with a typical post on the same platform.
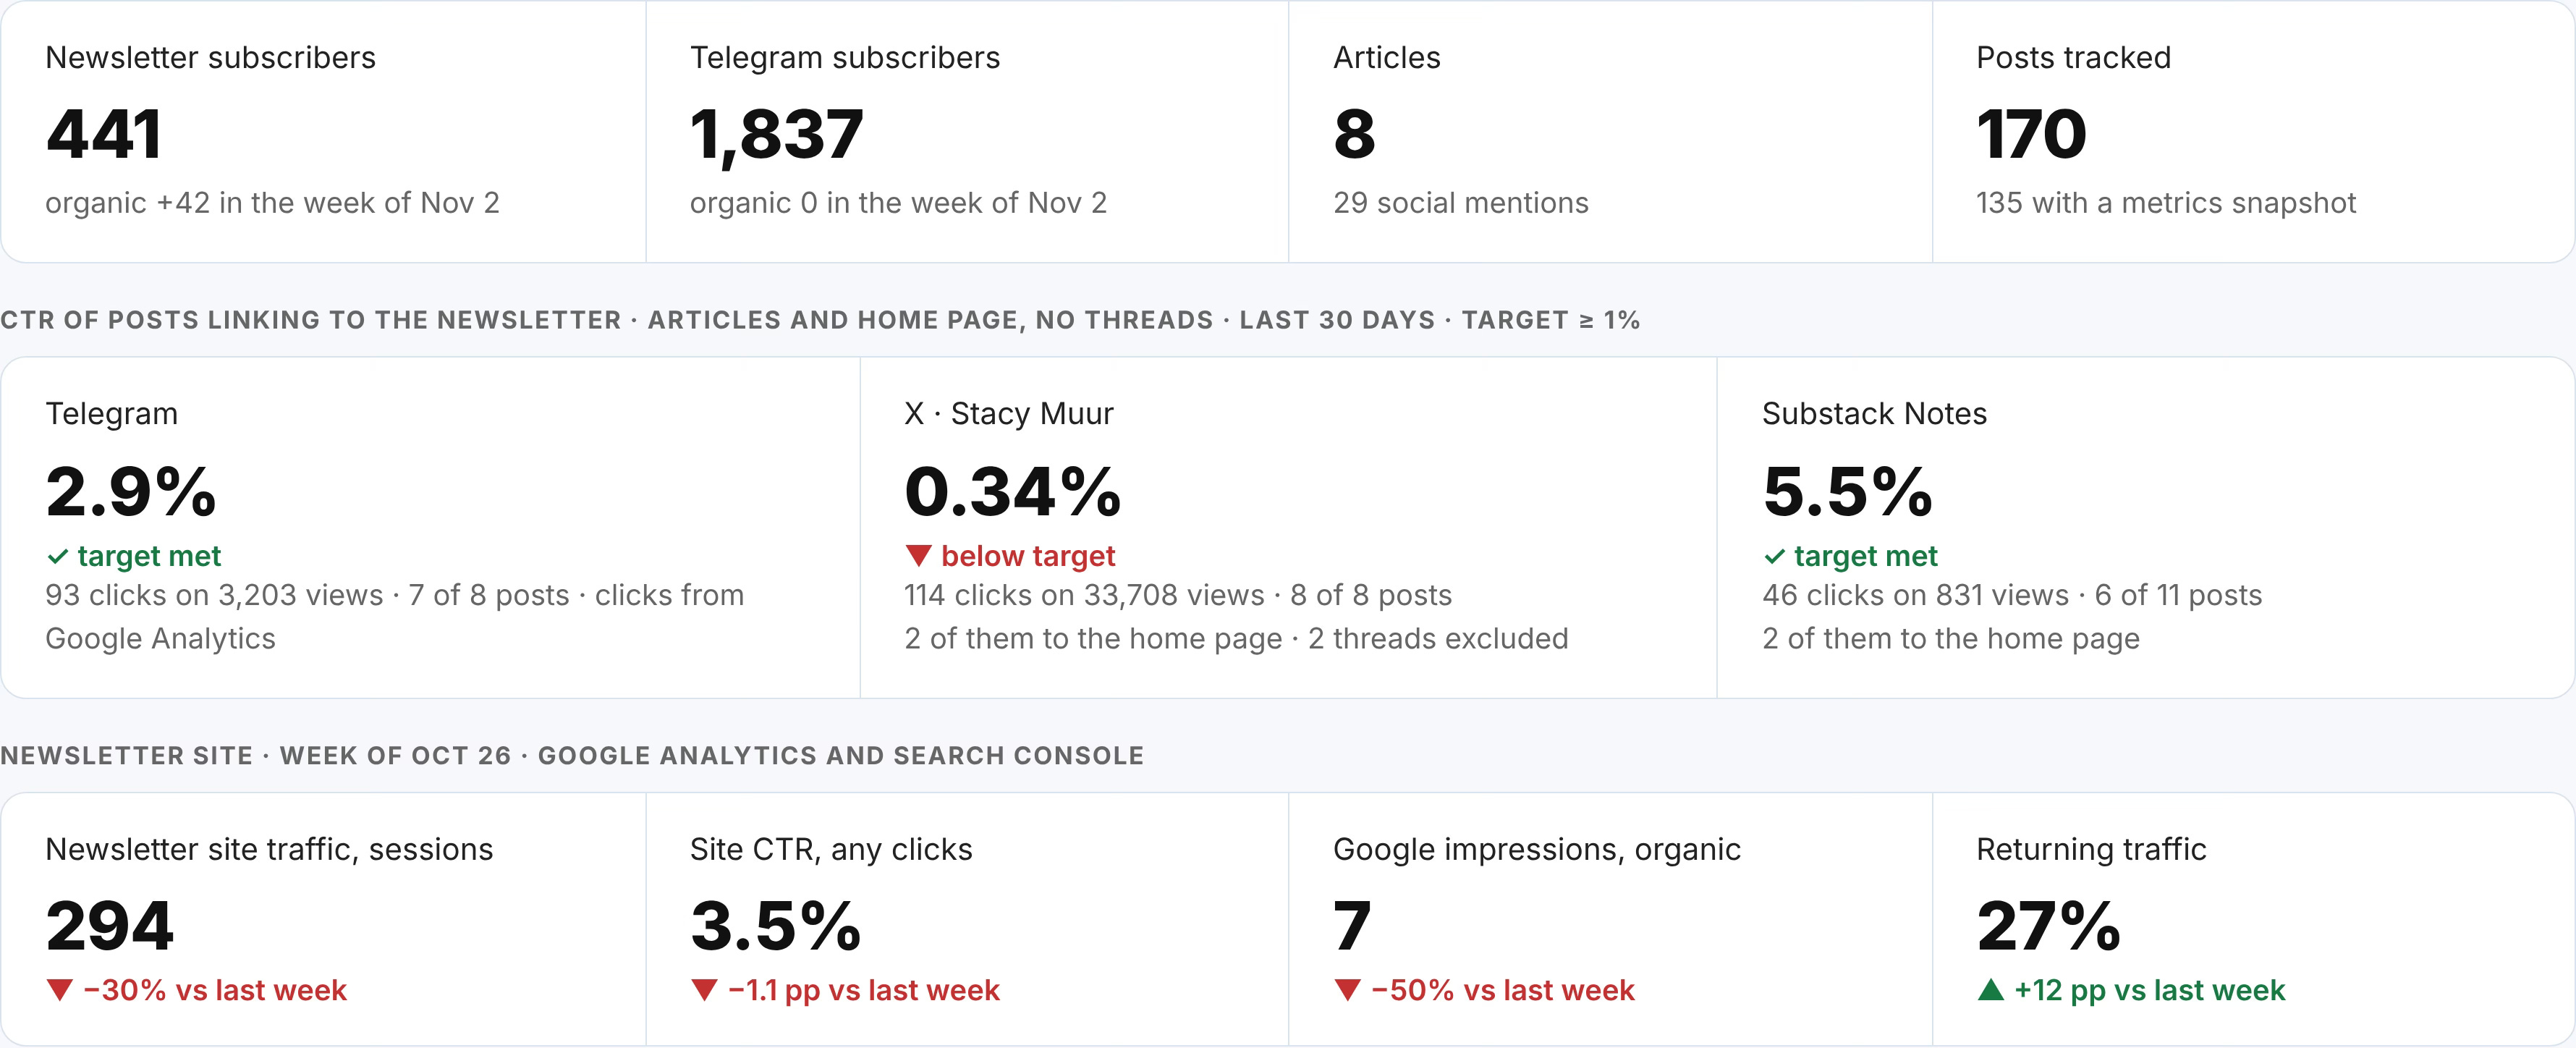
For posts that link to an article: clicks and CTR. The target is 1%.
Copies across platforms, so I can see where the same content works best.
Per week, per channel
Followers or subscribers gained and lost, with imported and paid subscribers counted separately from organic growth.
Views, shares, reactions.
Where new newsletter subscribers came from: direct visits, X, Substack recommendations, my own notes, other people’s notes.
Per article
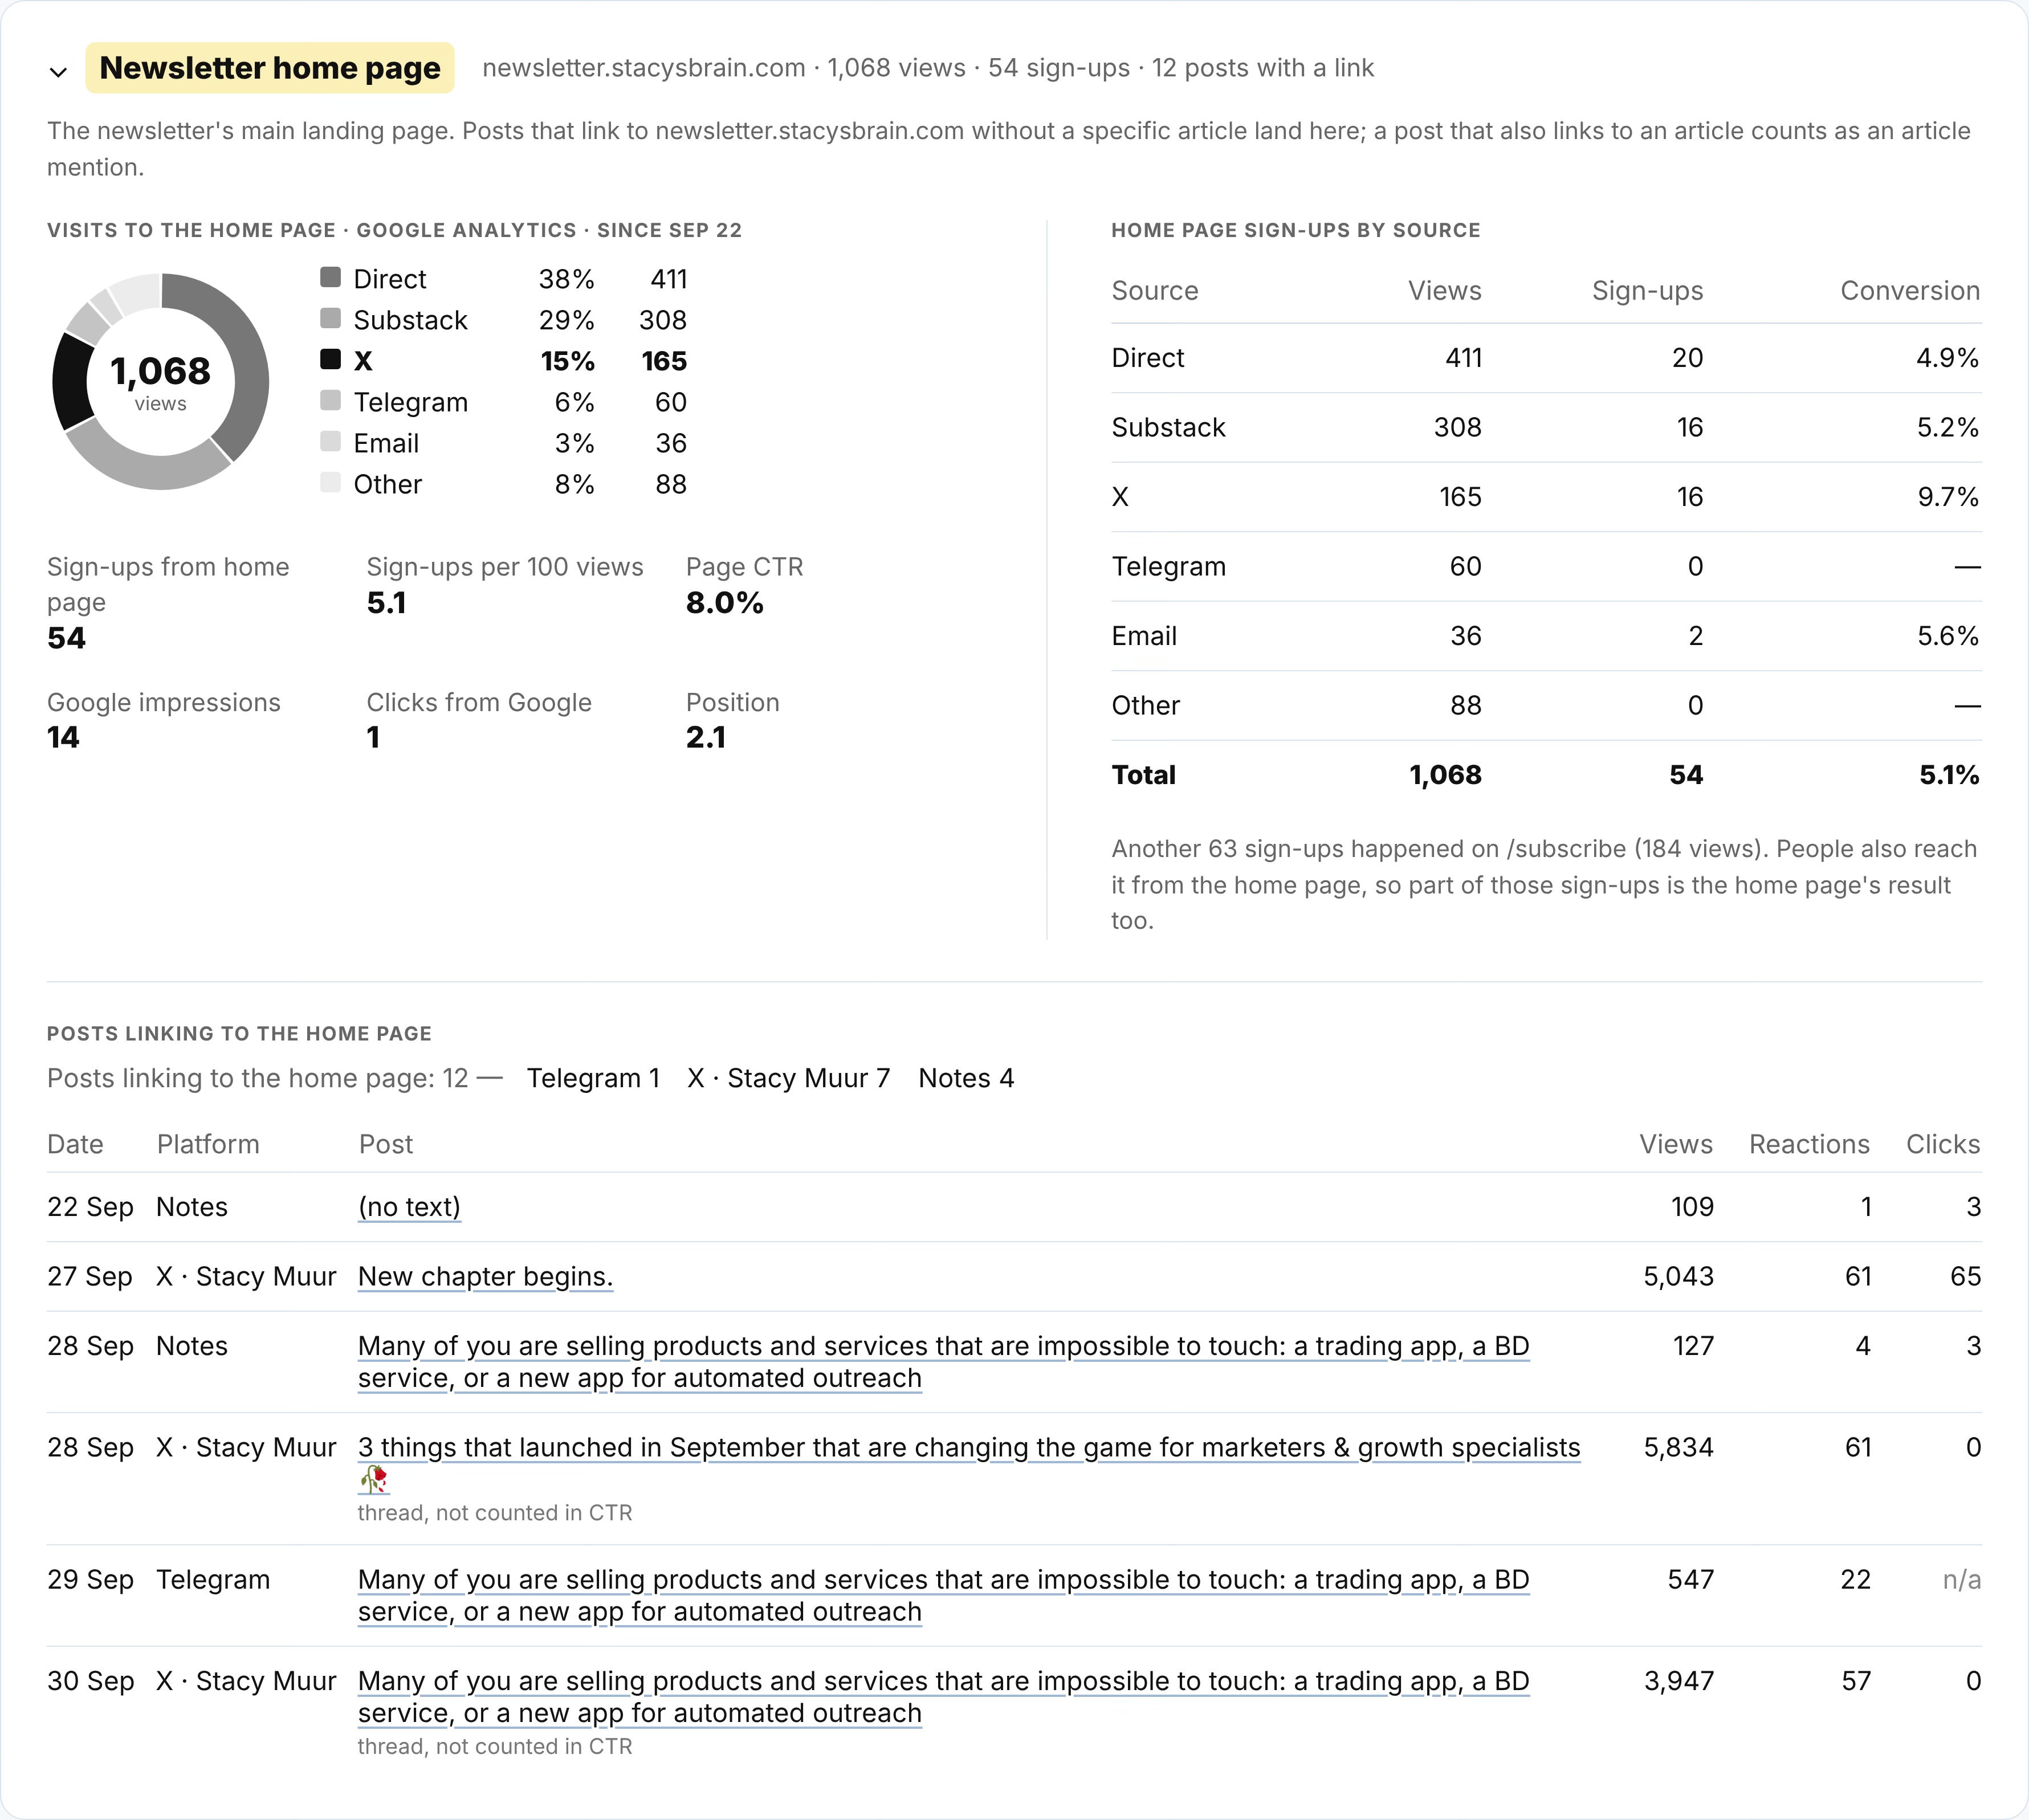
Views by source, sign-ups from the page, and search impressions.
Promotion windows: a reminder when an article is due for another mention (around day 2, day 14, day 30 and day 90).
Decisions it has already changed
These are real, from the last six weeks.
No more links buried in X threads
Posts with a link inside a thread converted at 0.07%. Single posts with a link converted at 1.16%. GA4 confirmed it independently: 1–2 visits after a thread, 7–17 after a single post.Paid newsletter mentions are off the plan
I spent $2,258 on Substack placements and got 40 subscribers, about $56 each. My target was $5. Paid recommendations from smaller newsletters did better than sponsored mentions, but organic still wins.Not all subscribers are equal
Subscribers who came through Substack recommendations open about 19% of emails, readers from X about 42%, and people who subscribed through Substack’s own prompt in emails 58%. Imported contacts from Stacy’s Brain open emails but almost never click or share. Every share in a month came from people who subscribed on their own.Practical guides beat reviews
The $0 marketing budget guide got 893 views and 16 new subscribers. A typical issue gets 170–340 views and 1–5 subscribers.Telegram needed UTM links
The Telegram app hides the source, so its readers showed up as “direct” traffic. Now every link from the channel carries a tag, and I can finally see what the channel sends to the newsletter.Gut feeling is a bad predictor
Posts I expected to fly were average, and some throwaway ones went far. Classic, even for people who have been focusing on content for years :)
If you want to build your own, here’s what I suggest starting with
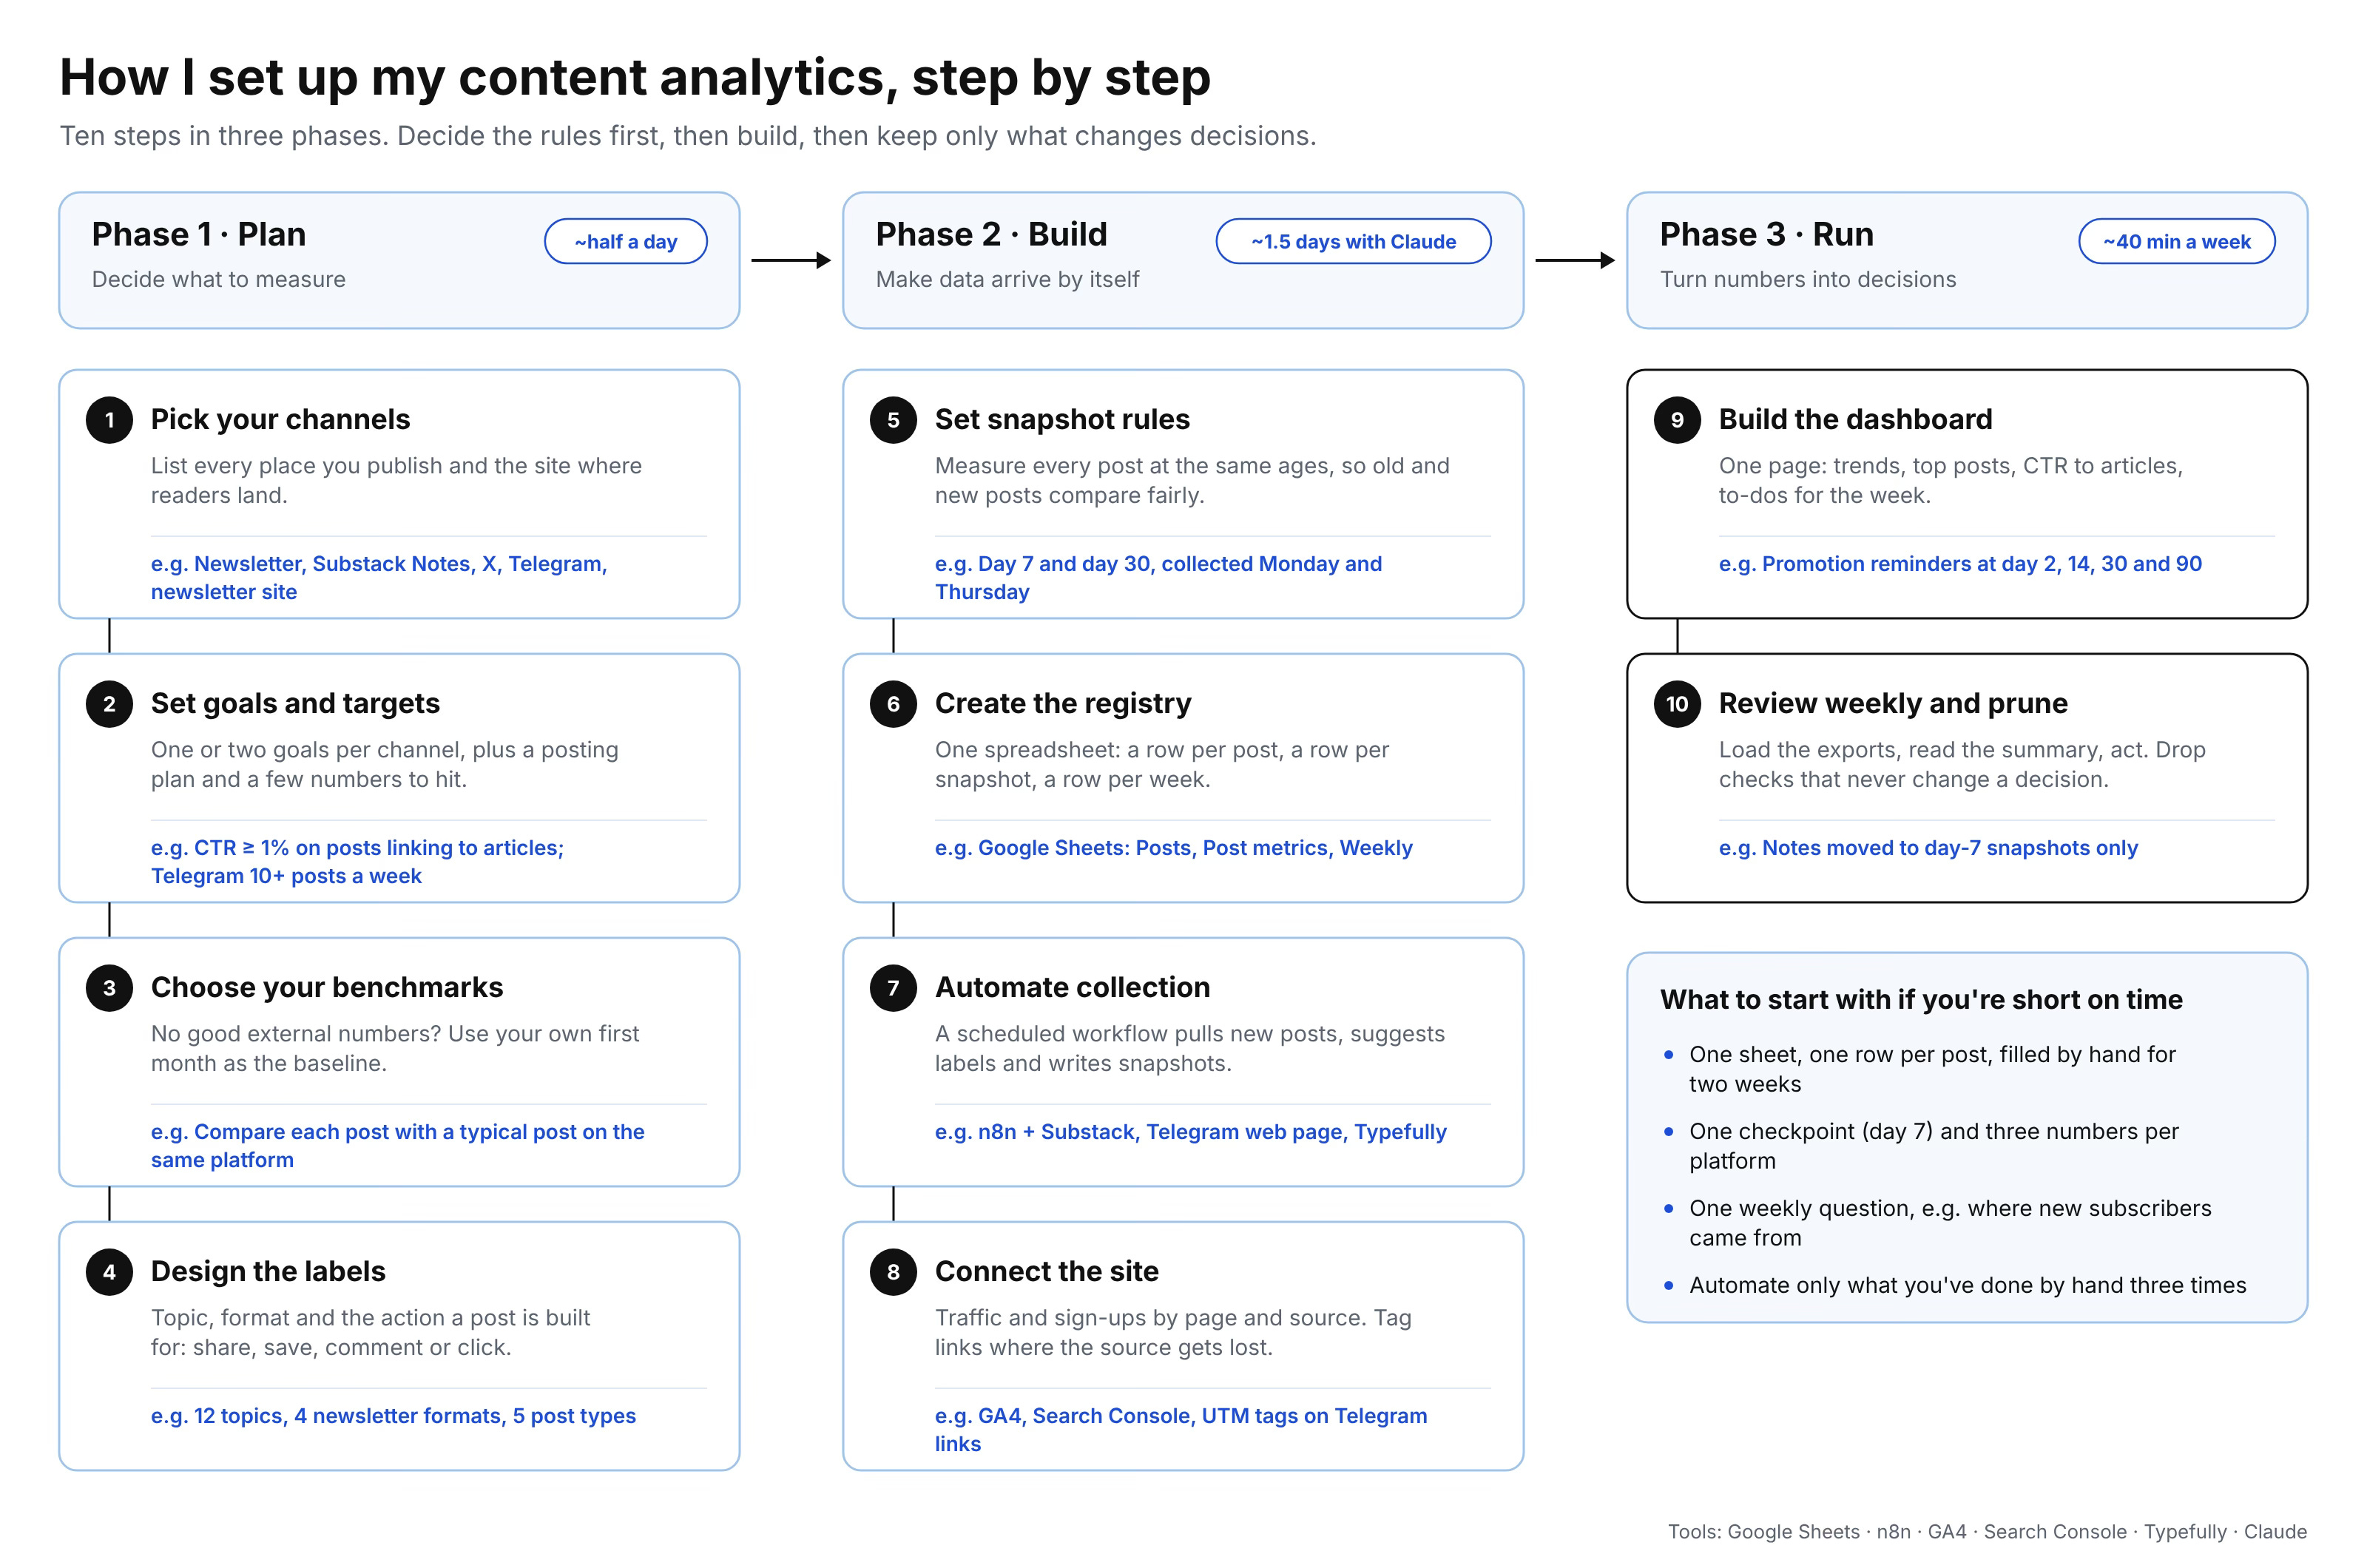
Start smaller than this:
One sheet, one row per post, with a link, a topic and a post type. Do this by hand for two weeks — otherwise you won’t know the jobs you need to automate and the important details essential for the system.
One fixed checkpoint (day 7) and three numbers per platform that matter to you.
One weekly question, like “where did new subscribers come from this week?”, answered from exports.
Automate only what you’ve done by hand at least three times (!) That’s when you know the rule well enough to write it down.
Claude helps most in steps 2–4. It writes the workflow and formulas, reads messy exports, and catches mistakes — but it can’t decide what matters to you and it will always have inefficient business context, no matter how detailed your prompt is. Decide that first.